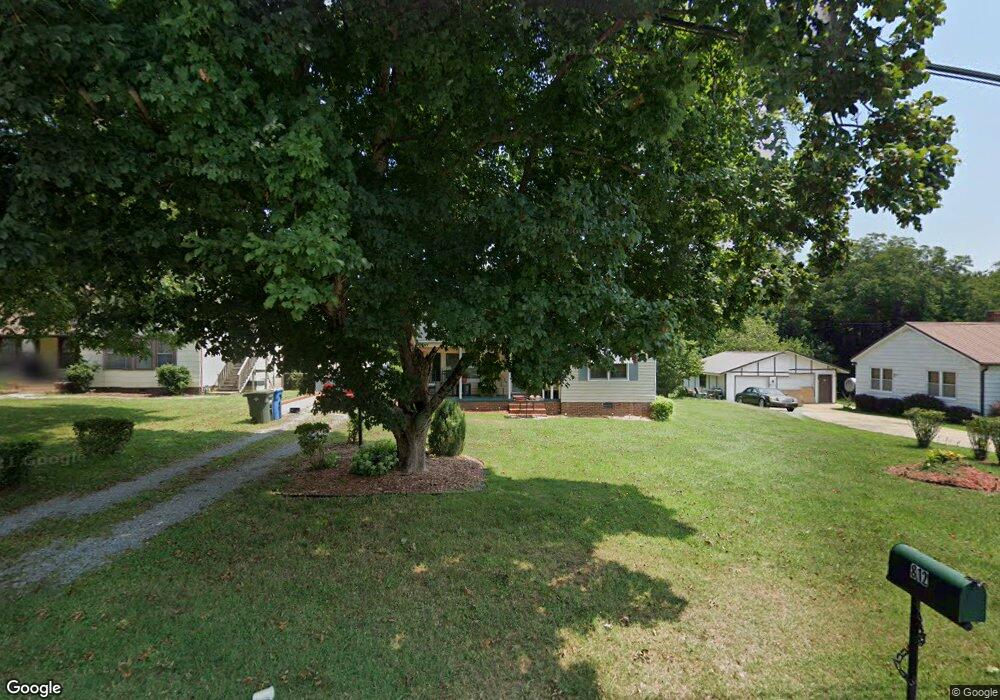
812 E Lafayette St Salisbury, NC 28144
Estimated Value: $143,000 - $167,000
2
Beds
1
Bath
954
Sq Ft
$163/Sq Ft
Est. Value
About This Home
This home is located at 812 E Lafayette St, Salisbury, NC 28144 and is currently estimated at $155,249, approximately $162 per square foot. 812 E Lafayette St is a home located in Rowan County with nearby schools including Elizabeth Duncan Koontz Elementary School, North Rowan Middle School, and Salisbury High School.
Ownership History
Date
Name
Owned For
Owner Type
Purchase Details
Closed on
Oct 4, 2019
Sold by
Exodus Financial Llc
Bought by
Homes By Exodus Llc
Current Estimated Value
Home Financials for this Owner
Home Financials are based on the most recent Mortgage that was taken out on this home.
Original Mortgage
$286,300
Outstanding Balance
$251,830
Interest Rate
3.7%
Mortgage Type
Commercial
Estimated Equity
-$96,581
Purchase Details
Closed on
Mar 28, 2019
Sold by
Wimmer Mark and Wimmer Melissa H
Bought by
Exodus Financial Llc
Home Financials for this Owner
Home Financials are based on the most recent Mortgage that was taken out on this home.
Original Mortgage
$270,600
Interest Rate
4.3%
Mortgage Type
Future Advance Clause Open End Mortgage
Purchase Details
Closed on
Aug 1, 2011
Sold by
Linker Ronnie L and Linker Teresa C
Bought by
Wimmer Mark A and Wimmer Melissa H
Create a Home Valuation Report for This Property
The Home Valuation Report is an in-depth analysis detailing your home's value as well as a comparison with similar homes in the area
Home Values in the Area
Average Home Value in this Area
Purchase History
| Date | Buyer | Sale Price | Title Company |
|---|---|---|---|
| Homes By Exodus Llc | -- | None Available | |
| Exodus Financial Llc | $45,000 | None Available | |
| Wimmer Mark A | $93,450 | None Available |
Source: Public Records
Mortgage History
| Date | Status | Borrower | Loan Amount |
|---|---|---|---|
| Open | Homes By Exodus Llc | $286,300 | |
| Previous Owner | Exodus Financial Llc | $270,600 |
Source: Public Records
Tax History
| Year | Tax Paid | Tax Assessment Tax Assessment Total Assessment is a certain percentage of the fair market value that is determined by local assessors to be the total taxable value of land and additions on the property. | Land | Improvement |
|---|---|---|---|---|
| 2025 | $1,568 | $131,101 | $23,925 | $107,176 |
| 2024 | $1,568 | $131,101 | $23,925 | $107,176 |
| 2023 | $1,568 | $131,101 | $23,925 | $107,176 |
| 2022 | $842 | $61,176 | $18,150 | $43,026 |
| 2021 | $842 | $61,176 | $18,150 | $43,026 |
| 2020 | $842 | $61,176 | $18,150 | $43,026 |
| 2019 | $842 | $61,176 | $18,150 | $43,026 |
| 2018 | $745 | $54,857 | $18,150 | $36,707 |
| 2017 | $741 | $54,857 | $18,150 | $36,707 |
| 2016 | $721 | $54,857 | $18,150 | $36,707 |
| 2015 | $725 | $54,857 | $18,150 | $36,707 |
| 2014 | $742 | $56,769 | $18,562 | $38,207 |
Source: Public Records
Map
Nearby Homes
- 915 Reeves St
- 628 E Lafayette St
- 505 E Cemetery St
- 215 Green St
- 510 Fairbluff Ave
- 613 E Liberty St
- 205 N Martin Luther King jr Ave
- 0 Skyline Dr
- 000 Bringle Ferry Rd
- 1138 Laurel St
- 1102 Grady St
- 500 W Council St
- 224 E Steele St
- 1270 N Shaver St
- 1280 N Shaver St
- 1214 Short St
- 1129 Kenly St
- 1121 Richard St
- 115 E Steele St
- 1411 N Long St
- 810 E Lafayette St
- 820 E Lafayette St
- 824 E Lafayette St
- 807 Reeves St Unit A
- 807 Reeves St Unit B
- 807 Reeves St
- 817 E Lafayette St
- 803 Reeves St
- 807A Reeves St Unit B
- 616 Green St
- 616 Green St Unit 1
- 907 Reeves St
- 731 E Lafayette St
- 708 Green St
- 607 Green St
- 911 Reeves St
- 706 Hayden St
- 816 E Franklin St
- 810 E Franklin St
- 723 Bringle Ferry Rd