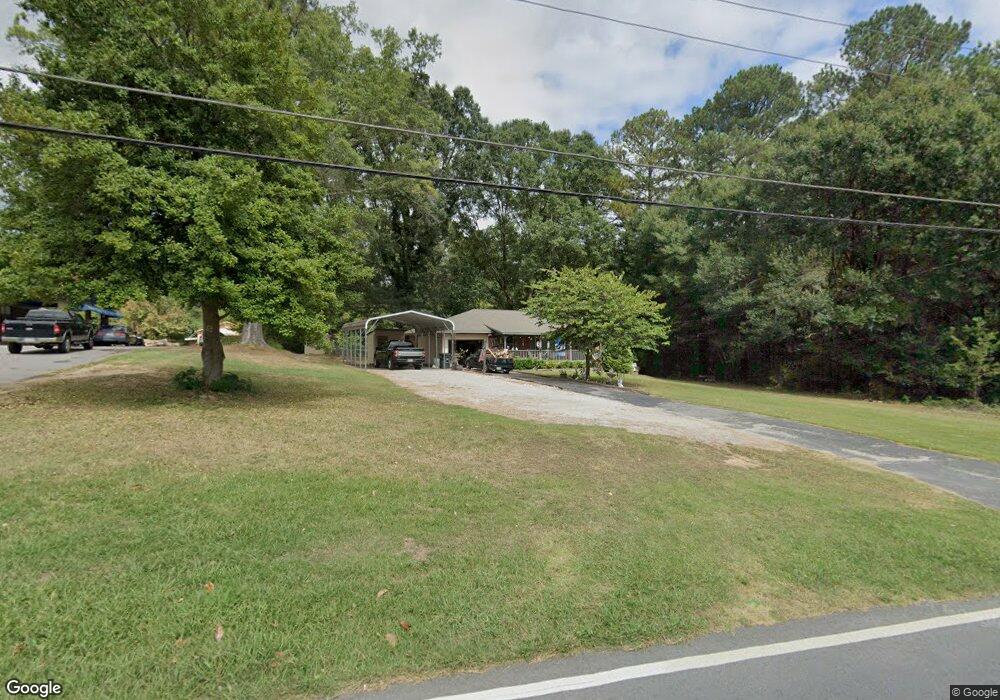
812 E Line St Calhoun, GA 30701
Estimated Value: $233,000 - $278,000
3
Beds
2
Baths
1,398
Sq Ft
$177/Sq Ft
Est. Value
About This Home
This home is located at 812 E Line St, Calhoun, GA 30701 and is currently estimated at $246,769, approximately $176 per square foot. 812 E Line St is a home located in Gordon County with nearby schools including Calhoun Primary School, Calhoun Elementary School, and Calhoun Middle School.
Ownership History
Date
Name
Owned For
Owner Type
Purchase Details
Closed on
Jul 23, 2025
Sold by
Roberts John B
Bought by
Evans Clayton
Current Estimated Value
Home Financials for this Owner
Home Financials are based on the most recent Mortgage that was taken out on this home.
Original Mortgage
$9,540
Outstanding Balance
$9,524
Interest Rate
6.77%
Mortgage Type
New Conventional
Estimated Equity
$237,245
Purchase Details
Closed on
Oct 22, 2019
Sold by
Cartecay River Holdings Llc
Bought by
Roberts John B and Roberts Jean Berks
Home Financials for this Owner
Home Financials are based on the most recent Mortgage that was taken out on this home.
Original Mortgage
$80,270
Interest Rate
3.6%
Mortgage Type
VA
Purchase Details
Closed on
Jun 2, 2009
Sold by
Fox Debbie
Bought by
Cartecay River Holdings Llc
Home Financials for this Owner
Home Financials are based on the most recent Mortgage that was taken out on this home.
Original Mortgage
$77,900
Interest Rate
4.77%
Mortgage Type
Purchase Money Mortgage
Create a Home Valuation Report for This Property
The Home Valuation Report is an in-depth analysis detailing your home's value as well as a comparison with similar homes in the area
Home Values in the Area
Average Home Value in this Area
Purchase History
| Date | Buyer | Sale Price | Title Company |
|---|---|---|---|
| Evans Clayton | $238,500 | -- | |
| Roberts John B | $80,270 | -- | |
| Cartecay River Holdings Llc | $82,000 | -- | |
| Fox Debbie | -- | -- |
Source: Public Records
Mortgage History
| Date | Status | Borrower | Loan Amount |
|---|---|---|---|
| Open | Evans Clayton | $9,540 | |
| Open | Evans Clayton | $233,007 | |
| Previous Owner | Roberts John B | $80,270 | |
| Previous Owner | Cartecay River Holdings Llc | $77,900 |
Source: Public Records
Tax History Compared to Growth
Tax History
| Year | Tax Paid | Tax Assessment Tax Assessment Total Assessment is a certain percentage of the fair market value that is determined by local assessors to be the total taxable value of land and additions on the property. | Land | Improvement |
|---|---|---|---|---|
| 2024 | -- | $50,432 | $5,880 | $44,552 |
| 2023 | $596 | $44,432 | $5,600 | $38,832 |
| 2022 | $382 | $42,112 | $5,600 | $36,512 |
| 2021 | $385 | $33,080 | $5,600 | $27,480 |
| 2020 | $376 | $33,560 | $5,600 | $27,960 |
| 2019 | $1,006 | $33,560 | $5,600 | $27,960 |
| 2017 | $268 | $27,240 | $5,320 | $21,920 |
| 2016 | $268 | $27,240 | $5,320 | $21,920 |
| 2015 | $255 | $25,600 | $5,320 | $20,280 |
| 2014 | $216 | $21,918 | $4,760 | $17,158 |
Source: Public Records
Map
Nearby Homes
- 113 Oakhurst Terrace NE
- 201 Crestmont Dr
- 202 Montclair Dr
- 104 Bobwhite Dr
- 107 Bobwhite Dr
- 105 Bobwhite Dr
- 229 Hillcrest Dr
- 121 Hunt Dr
- 511 Boulevard Heights
- 421 Boulevard Heights
- 105 Garden Hill Dr
- 111 Meadow Ln
- 515 Woodlawn Ave
- 114 Lindsey Ct NE
- 198 Hillcrest Dr
- 112 Willowbrook Dr SE
- 127 Windsor Dr
- 110 Boston Rd
- 209 Willowbrook Dr SE
- 107 Savoy Place SE
- 810 E Line St
- 19 Wexford Dr NE
- 808 E Line St
- 105 Wexford Dr NE
- 104 Crestmont Way
- 104 Crestmont Dr
- 103 Chastain St
- 811 E Line St
- 806 E Line St
- 106 Crestmont Dr
- 103 Crestmont Way
- 111 Wexford Dr NE
- 102 Crestmont Dr
- 110 Wexford Dr NE
- 102 Crestmont Way
- 108 Crestmont Dr
- 117 Oakhurst Terrace NE
- 111 Oakhurst Terrace NE
- 00 Wexford Dr
- 0 Wexford Dr NE Unit 8431495