Estimated Value: $232,000 - $671,953
--
Bed
--
Bath
1,344
Sq Ft
$378/Sq Ft
Est. Value
About This Home
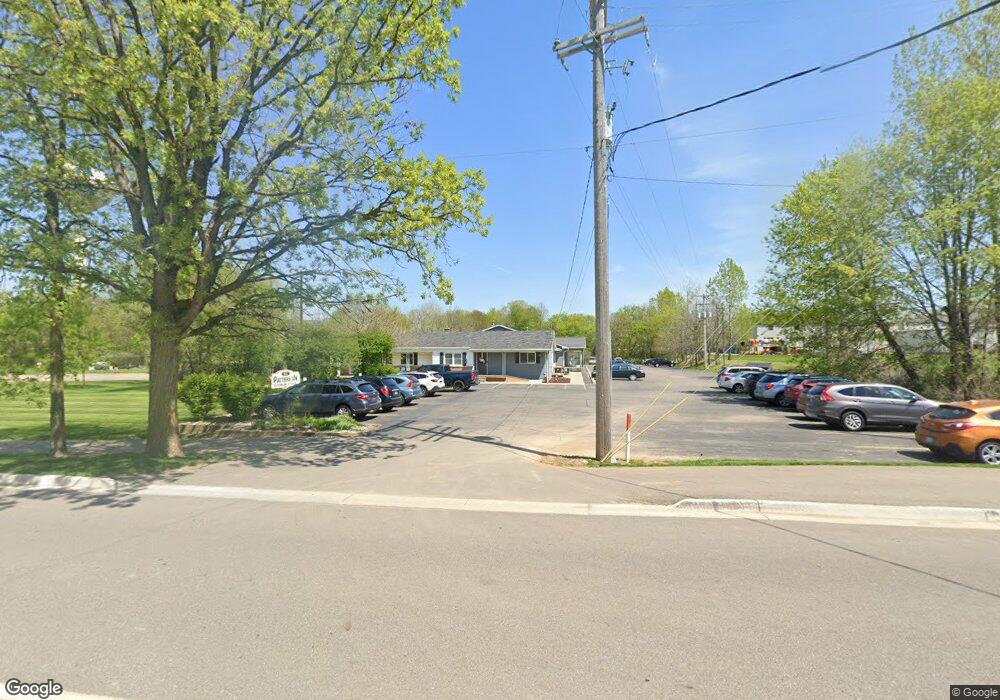
This home is located at 812 Kerns Rd, Mason, MI 48854 and is currently estimated at $508,318, approximately $378 per square foot. 812 Kerns Rd is a home with nearby schools including Mason High School.
Ownership History
Date
Name
Owned For
Owner Type
Purchase Details
Closed on
Sep 18, 2018
Sold by
Driscoll Investments Llc
Bought by
Aurora Rose Real Estate Llc
Current Estimated Value
Home Financials for this Owner
Home Financials are based on the most recent Mortgage that was taken out on this home.
Original Mortgage
$520,000
Outstanding Balance
$452,537
Interest Rate
4.5%
Mortgage Type
Stand Alone Second
Estimated Equity
$55,781
Purchase Details
Closed on
Mar 31, 2015
Sold by
Patterson Dail W and Patterson Janice L
Bought by
Driscoll Investments Llc
Home Financials for this Owner
Home Financials are based on the most recent Mortgage that was taken out on this home.
Original Mortgage
$524,800
Interest Rate
3.73%
Mortgage Type
Future Advance Clause Open End Mortgage
Purchase Details
Closed on
Aug 2, 2006
Sold by
Patterson Dail W and Pitlanish Janice L
Bought by
Patterson Dail W and Pitlanish Janice L
Create a Home Valuation Report for This Property
The Home Valuation Report is an in-depth analysis detailing your home's value as well as a comparison with similar homes in the area
Home Values in the Area
Average Home Value in this Area
Purchase History
| Date | Buyer | Sale Price | Title Company |
|---|---|---|---|
| Aurora Rose Real Estate Llc | -- | None Available | |
| Driscoll Investments Llc | -- | None Available | |
| Patterson Dail W | -- | None Available |
Source: Public Records
Mortgage History
| Date | Status | Borrower | Loan Amount |
|---|---|---|---|
| Open | Aurora Rose Real Estate Llc | $520,000 | |
| Previous Owner | Driscoll Investments Llc | $524,800 | |
| Previous Owner | Driscoll Investments Llc | $56,000 |
Source: Public Records
Tax History Compared to Growth
Tax History
| Year | Tax Paid | Tax Assessment Tax Assessment Total Assessment is a certain percentage of the fair market value that is determined by local assessors to be the total taxable value of land and additions on the property. | Land | Improvement |
|---|---|---|---|---|
| 2025 | $29,346 | $434,440 | $158,990 | $275,450 |
| 2024 | $27,982 | $389,040 | $127,200 | $261,840 |
| 2023 | $27,982 | $375,750 | $127,200 | $248,550 |
| 2022 | $28,559 | $383,870 | $133,560 | $250,310 |
| 2021 | $28,242 | $381,150 | $133,560 | $247,590 |
| 2020 | $27,926 | $376,750 | $133,560 | $243,190 |
| 2019 | $26,879 | $388,590 | $127,200 | $261,390 |
| 2018 | $25,849 | $385,920 | $93,000 | $292,920 |
| 2017 | $25,381 | $385,920 | $93,000 | $292,920 |
| 2016 | -- | $413,060 | $97,180 | $315,880 |
| 2015 | -- | $400,490 | $194,365 | $206,125 |
| 2014 | -- | $344,160 | $69,957 | $274,203 |
Source: Public Records
Map
Nearby Homes
- 1470 N Cedar St
- 411 Bubbling Springs Ct
- 330 Oak Ridge St
- 990 Windjammer Ct
- 2995 Harper Rd
- 871 Dart Rd
- 209 Peachtree Place
- 673 Joan Dr
- 32 Aviemore Dr Unit 32
- 331 N College Rd
- 902 Eagles Nest Ct
- 116 E Elm St
- 427 E Ash St
- 317 E Elm St
- 327 Steele St
- 0 Sanctuary
- 434 Ravenwood Ct
- 311 Carom Cir
- 117 Lawton St
- 105 Carom Cir
- 807 Kerns Rd
- 807 N Kerns Rd
- 831 Kim Dr
- 841 Kim Dr
- 2870 W Howell Rd
- 2790 W Howell Rd
- 0 N Cedar St Unit 27735
- 0 N Cedar St Unit 28046
- 0 N Cedar St Unit 28047
- 0 N Cedar St
- 0 N Cedar St Unit 27732
- 0 N Cedar St
- 0 N Cedar St Unit 65428
- 0 N Cedar St Unit 67441
- 0 N Cedar St Unit 79810
- 0 N Cedar St Unit 79707
- 0 N Cedar St Unit 188311
- 0 N Cedar St Unit 27734
- 0 N Cedar St Unit 27733
- 2928 W Howell Rd