Estimated Value: $43,000 - $222,000
--
Bed
1
Bath
1,748
Sq Ft
$56/Sq Ft
Est. Value
About This Home
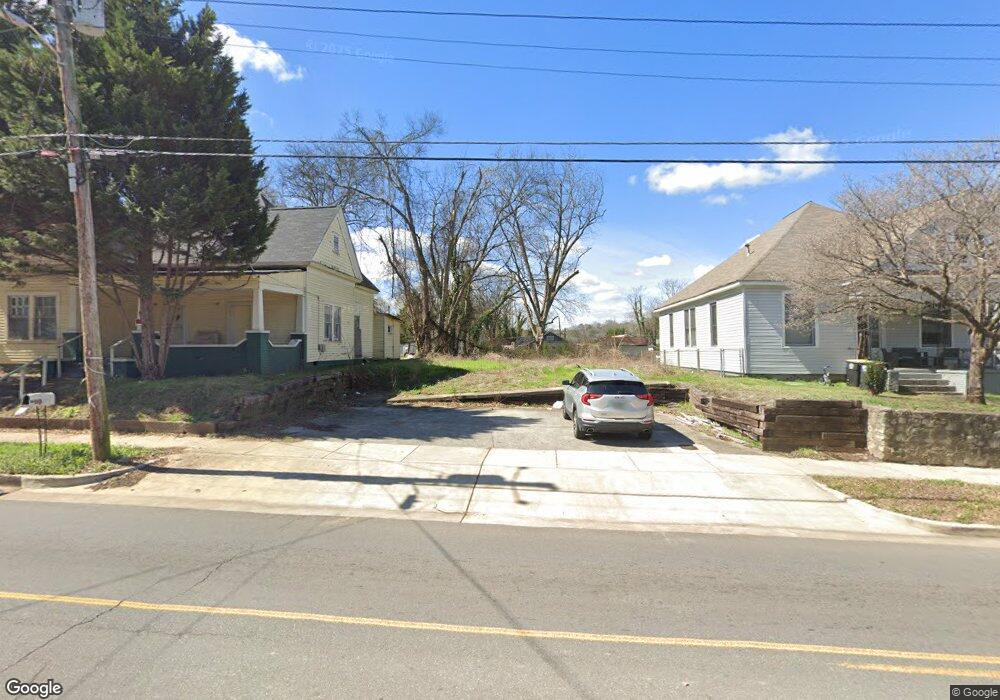
This home is located at 812 Maple Ave SW, Rome, GA 30161 and is currently estimated at $98,462, approximately $56 per square foot. 812 Maple Ave SW is a home located in Floyd County with nearby schools including Dan McCarty Middle School, Rome High School, and St. Mary School.
Ownership History
Date
Name
Owned For
Owner Type
Purchase Details
Closed on
Sep 4, 2024
Sold by
Montalvo Hashanna
Bought by
Pereira Leobardo
Current Estimated Value
Purchase Details
Closed on
Aug 6, 2018
Sold by
T5j5b Holdings Llc
Bought by
Hashanna Montalvo
Purchase Details
Closed on
Jul 29, 2016
Sold by
Berry Thomas
Bought by
T5j5b Holdings Llc
Purchase Details
Closed on
May 31, 2013
Sold by
Berry Jane
Bought by
Berry Tom
Purchase Details
Closed on
Jan 31, 2000
Sold by
Berry Albert E and Berry Thomas
Bought by
Berry Thomas and Tom Ii Berry
Purchase Details
Closed on
Oct 28, 1991
Sold by
Hart Jack P
Bought by
Berry Albert E and Berry Thomas
Purchase Details
Closed on
May 15, 1973
Sold by
Jackson H E
Bought by
Hart Jack P
Purchase Details
Closed on
Mar 1, 1973
Sold by
Terrell David
Bought by
Jackson H E
Purchase Details
Closed on
Oct 12, 1972
Sold by
Sporman Chas F
Bought by
Terrell David
Purchase Details
Closed on
Jul 8, 1972
Sold by
Sporman Neil C Mrs
Bought by
Sporman Chas F
Purchase Details
Closed on
Jan 1, 1901
Bought by
Sporman Neil C Mrs
Create a Home Valuation Report for This Property
The Home Valuation Report is an in-depth analysis detailing your home's value as well as a comparison with similar homes in the area
Home Values in the Area
Average Home Value in this Area
Purchase History
| Date | Buyer | Sale Price | Title Company |
|---|---|---|---|
| Pereira Leobardo | $5,000 | -- | |
| Hashanna Montalvo | $3,800 | -- | |
| T5j5b Holdings Llc | -- | -- | |
| Berry Tom | -- | -- | |
| Berry Thomas | $17,500 | -- | |
| Berry Albert E | $13,500 | -- | |
| Hart Jack P | -- | -- | |
| Jackson H E | $10,000 | -- | |
| Terrell David | $5,500 | -- | |
| Sporman Chas F | -- | -- | |
| Sporman Neil C Mrs | -- | -- |
Source: Public Records
Tax History Compared to Growth
Tax History
| Year | Tax Paid | Tax Assessment Tax Assessment Total Assessment is a certain percentage of the fair market value that is determined by local assessors to be the total taxable value of land and additions on the property. | Land | Improvement |
|---|---|---|---|---|
| 2024 | $221 | $5,616 | $5,616 | $0 |
| 2023 | $199 | $4,992 | $4,992 | $0 |
| 2022 | $148 | $4,056 | $4,056 | $0 |
| 2021 | $151 | $4,056 | $4,056 | $0 |
| 2020 | $117 | $3,120 | $3,120 | $0 |
| 2019 | $56 | $3,120 | $3,120 | $0 |
| 2018 | $348 | $9,410 | $3,120 | $6,290 |
| 2017 | $338 | $9,142 | $3,120 | $6,022 |
| 2016 | $333 | $8,960 | $3,120 | $5,840 |
| 2015 | -- | $8,960 | $3,120 | $5,840 |
| 2014 | -- | $8,960 | $3,120 | $5,840 |
Source: Public Records
Map
Nearby Homes
- 801 Maple Ave SW
- 2 Fair St SW
- 2 E 10th St SW
- 2 Coral Ave SW
- 702 River Ave SW
- 166 E 11th St SW
- 162 E 11th St SE
- 164 E 11th St SE
- 168 E 11th St SE
- 170 E 11th St SW
- 9 Eastridge Ct SW
- 31 Notasulga Dr SW
- 211 E 11th St SE
- 106 E 14th St SW
- 13 N Blanche Ave SW
- 4 E 15th St SW
- 206 E 4th St
- 1502 Spring Creek St SW
- 810 Maple Ave SW
- 814 Maple Ave SW
- 808 Maple Ave SW
- 816 Maple Ave SW
- 818 Maple Ave SW
- 601 Walnut Ave SW
- 603 Walnut Ave SW
- 603 Walnut Ave SE
- 818 Maple Ave SE
- 605 Walnut Ave SW
- 599 Walnut Ave SW
- 804 Maple Ave SW
- 9 E 9th St SW
- 605 Walnut Ave SE Unit 605-609
- 607 Walnut Ave SW
- 809 Maple Ave SW
- 807 Maple Ave SW
- 813 Maple Ave SW
- 805 Maple Ave SW
- 817 Maple Ave SW