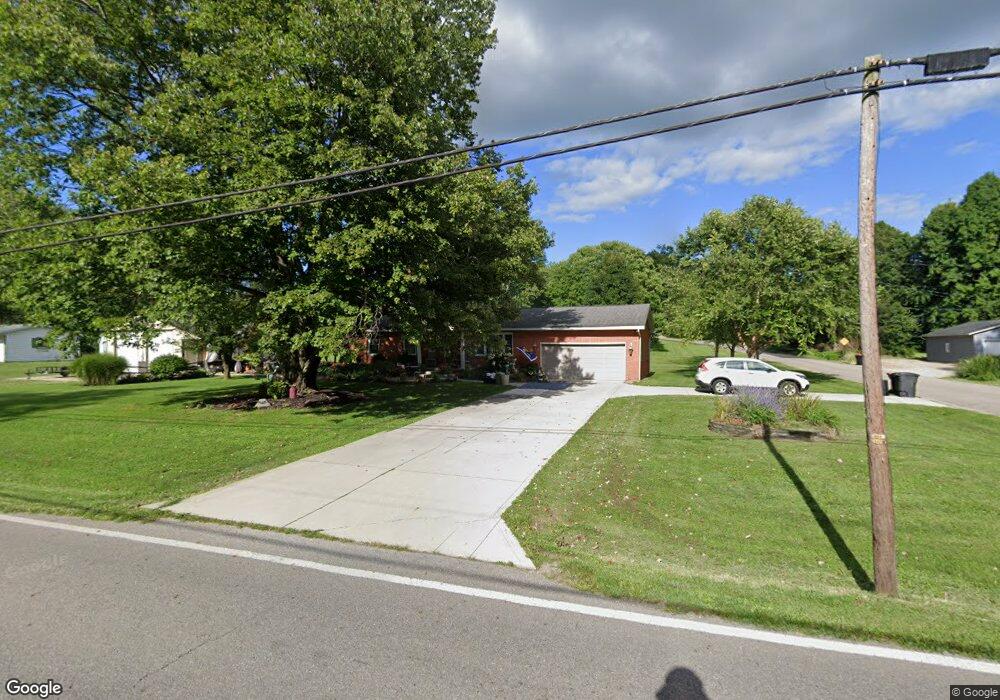
812 N Main St Newark, OH 43055
Estimated Value: $295,674 - $339,000
3
Beds
2
Baths
1,762
Sq Ft
$186/Sq Ft
Est. Value
About This Home
This home is located at 812 N Main St, Newark, OH 43055 and is currently estimated at $327,419, approximately $185 per square foot. 812 N Main St is a home located in Licking County with nearby schools including Licking Valley Elementary School, Licking Valley Middle School, and Licking Valley High School.
Ownership History
Date
Name
Owned For
Owner Type
Purchase Details
Closed on
Aug 8, 2016
Sold by
Phillips Mark A
Bought by
Depriest Bobbi J
Current Estimated Value
Home Financials for this Owner
Home Financials are based on the most recent Mortgage that was taken out on this home.
Original Mortgage
$105,000
Interest Rate
3.46%
Mortgage Type
New Conventional
Purchase Details
Closed on
May 18, 2010
Sold by
Redman Jay Robert and Redman Sharon
Bought by
Phillips Mark A
Purchase Details
Closed on
Dec 10, 2002
Sold by
Shrf Fred Lyons Pr
Bought by
Phillips Mark
Home Financials for this Owner
Home Financials are based on the most recent Mortgage that was taken out on this home.
Original Mortgage
$113,005
Interest Rate
6.38%
Mortgage Type
New Conventional
Purchase Details
Closed on
Mar 11, 1998
Sold by
O'Flaherty Dale L
Bought by
Smith Fred Lyons Laurie C
Home Financials for this Owner
Home Financials are based on the most recent Mortgage that was taken out on this home.
Original Mortgage
$108,385
Interest Rate
7.23%
Mortgage Type
FHA
Create a Home Valuation Report for This Property
The Home Valuation Report is an in-depth analysis detailing your home's value as well as a comparison with similar homes in the area
Home Values in the Area
Average Home Value in this Area
Purchase History
| Date | Buyer | Sale Price | Title Company |
|---|---|---|---|
| Depriest Bobbi J | -- | None Available | |
| Phillips Mark A | $7,000 | Kent Title | |
| Phillips Mark | $116,500 | -- | |
| Smith Fred Lyons Laurie C | $132,500 | -- |
Source: Public Records
Mortgage History
| Date | Status | Borrower | Loan Amount |
|---|---|---|---|
| Previous Owner | Depriest Bobbi J | $105,000 | |
| Previous Owner | Phillips Mark | $113,005 | |
| Previous Owner | Smith Fred Lyons Laurie C | $108,385 |
Source: Public Records
Tax History Compared to Growth
Tax History
| Year | Tax Paid | Tax Assessment Tax Assessment Total Assessment is a certain percentage of the fair market value that is determined by local assessors to be the total taxable value of land and additions on the property. | Land | Improvement |
|---|---|---|---|---|
| 2024 | $2,842 | $61,600 | $11,130 | $50,470 |
| 2023 | $3,473 | $61,600 | $11,130 | $50,470 |
| 2022 | $2,594 | $48,270 | $9,280 | $38,990 |
| 2021 | $2,646 | $48,270 | $9,280 | $38,990 |
| 2020 | $2,632 | $48,270 | $9,280 | $38,990 |
| 2019 | $2,605 | $44,140 | $8,370 | $35,770 |
| 2018 | $2,029 | $0 | $0 | $0 |
| 2017 | $1,214 | $0 | $0 | $0 |
| 2016 | $2,121 | $0 | $0 | $0 |
| 2015 | $2,031 | $0 | $0 | $0 |
| 2014 | $2,752 | $0 | $0 | $0 |
| 2013 | $879 | $0 | $0 | $0 |
Source: Public Records
Map
Nearby Homes
- 2920 E High St
- 193 New Home Dr NE
- 2378 W High St NE
- 2378 W High St
- 0 W High St NE
- 719 Colby Way NE
- 1698 Seven Hills Rd NE Unit Tract C
- 1698 Seven Hills Rd NE Unit Tract B
- 2387 Rock Haven Rd NE
- 13361 Bolen Rd NE
- 0 Briarcliff Rd Unit LotWP001
- 3286 Licking Valley Rd NE
- 17930 Bear Rd
- 10315 Marne Rd
- 10345 Marne Rd
- 137 Oakland Blvd NE
- 2365 Colling Rd SE
- 0 Briarcliff Rd
- 12491 Lesley Rd SE
- 52 Third St SE
- 848 NE Main St
- 825 N Main St
- 848 N Main St
- 145 Sunset Dr NE
- 117 Sunset Dr NE
- 782 N Main St
- 884 N Main St
- 841 N Main St NE
- 770 N Main St
- 0 NE Sunset Dr Unit 2923861
- 171 Sunset Dr NE
- 0 N Main St NE
- 841 N Main St
- 857 N Main St
- 184 Sunset Dr NE
- 771 N Main St
- 220 Sunset Dr NE
- 189 Sunset Dr NE
- 202 Sunset Dr NE
- 207 Sunset Dr NE