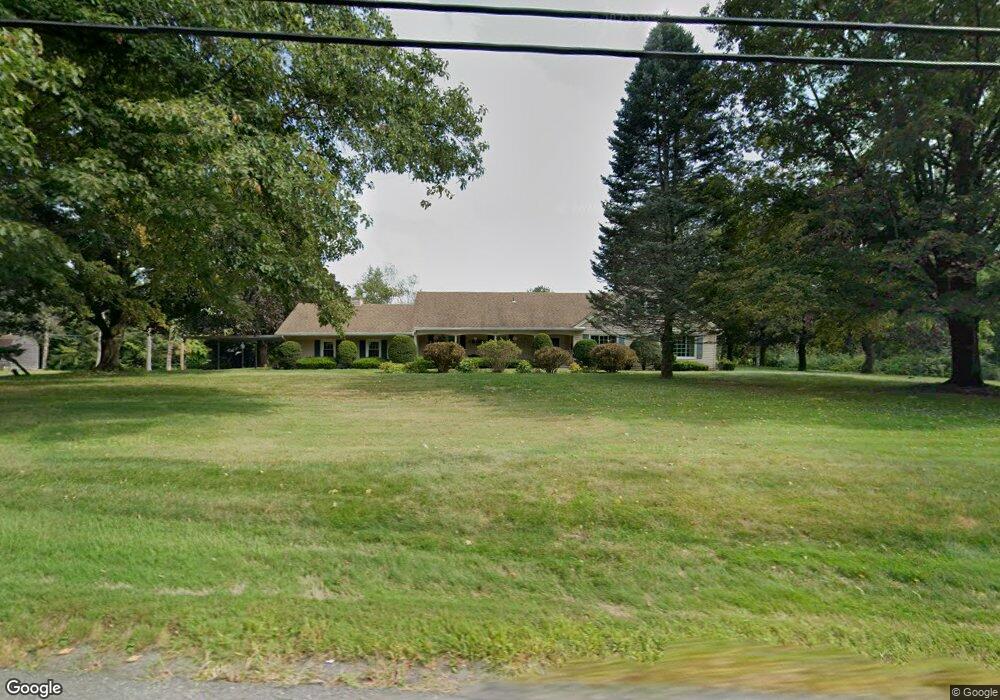
812 N State Rd Cheshire, MA 01225
Estimated Value: $497,000 - $836,000
3
Beds
4
Baths
2,550
Sq Ft
$236/Sq Ft
Est. Value
About This Home
This home is located at 812 N State Rd, Cheshire, MA 01225 and is currently estimated at $600,935, approximately $235 per square foot. 812 N State Rd is a home located in Berkshire County with nearby schools including Hoosac Valley Middle & High School, Berkshire Arts & Technology Charter Public School, and St. Stanislaus Kostka School.
Ownership History
Date
Name
Owned For
Owner Type
Purchase Details
Closed on
Jun 15, 2004
Sold by
Dorothy E Vincelette R and Bresnahan Shirlee
Bought by
Maston Delight C and Maston Lawrence E
Current Estimated Value
Home Financials for this Owner
Home Financials are based on the most recent Mortgage that was taken out on this home.
Original Mortgage
$114,000
Outstanding Balance
$55,690
Interest Rate
5.99%
Mortgage Type
Purchase Money Mortgage
Estimated Equity
$545,245
Create a Home Valuation Report for This Property
The Home Valuation Report is an in-depth analysis detailing your home's value as well as a comparison with similar homes in the area
Home Values in the Area
Average Home Value in this Area
Purchase History
| Date | Buyer | Sale Price | Title Company |
|---|---|---|---|
| Maston Delight C | $313,000 | -- | |
| Maston Delight C | $313,000 | -- |
Source: Public Records
Mortgage History
| Date | Status | Borrower | Loan Amount |
|---|---|---|---|
| Closed | Maston Delight C | $57,500 | |
| Open | Maston Delight C | $114,000 | |
| Closed | Maston Delight C | $114,000 |
Source: Public Records
Tax History
| Year | Tax Paid | Tax Assessment Tax Assessment Total Assessment is a certain percentage of the fair market value that is determined by local assessors to be the total taxable value of land and additions on the property. | Land | Improvement |
|---|---|---|---|---|
| 2025 | $4,950 | $444,700 | $75,300 | $369,400 |
| 2024 | $4,856 | $419,700 | $70,600 | $349,100 |
| 2023 | $4,600 | $384,300 | $72,700 | $311,600 |
| 2022 | $4,156 | $325,700 | $76,400 | $249,300 |
| 2021 | $4,147 | $310,200 | $72,700 | $237,500 |
| 2020 | $4,140 | $308,000 | $72,700 | $235,300 |
| 2019 | $4,068 | $310,500 | $72,700 | $237,800 |
| 2018 | $3,906 | $299,100 | $72,700 | $226,400 |
| 2017 | $3,706 | $299,100 | $72,700 | $226,400 |
| 2016 | $3,667 | $299,100 | $72,700 | $226,400 |
| 2015 | $3,575 | $299,400 | $65,800 | $233,600 |
Source: Public Records
Map
Nearby Homes
Your Personal Tour Guide
Ask me questions while you tour the home.