Estimated Value: $672,992 - $730,000
2
Beds
1
Bath
1,872
Sq Ft
$373/Sq Ft
Est. Value
About This Home
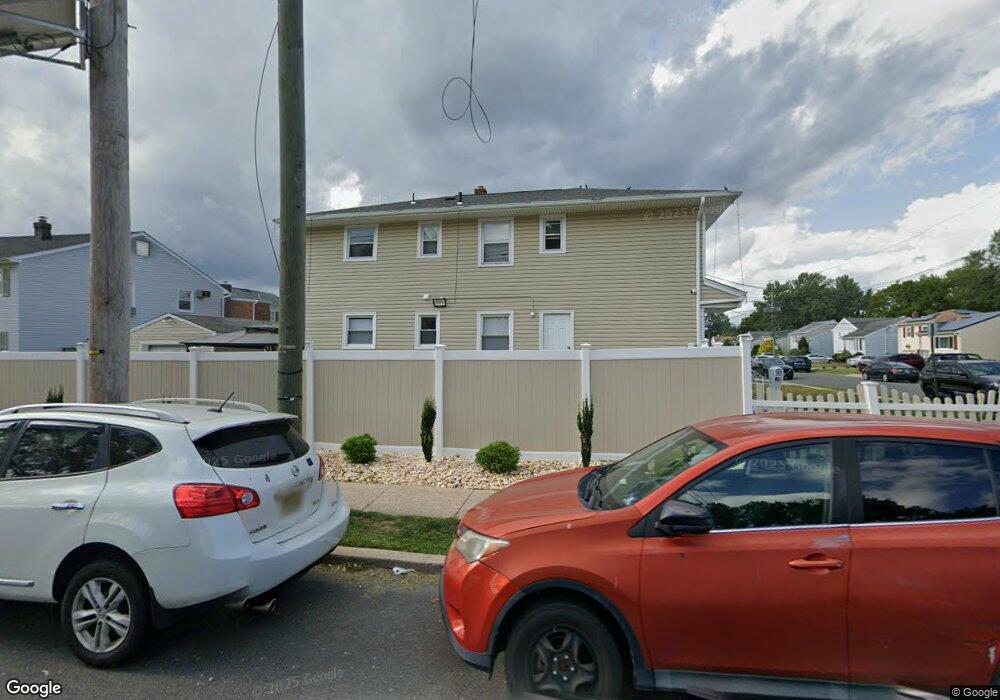
This home is located at 812 Niles Rd Unit 1, Union, NJ 07083 and is currently estimated at $697,748, approximately $372 per square foot. 812 Niles Rd Unit 1 is a home located in Union County with nearby schools including Connecticut Farms Elementary School, Burnet Middle School, and Union High School.
Ownership History
Date
Name
Owned For
Owner Type
Purchase Details
Closed on
May 20, 2021
Sold by
Tzezairlidis Michael
Bought by
Filho Servulo Alves Dos Santos and Fill Servuio Alves
Current Estimated Value
Home Financials for this Owner
Home Financials are based on the most recent Mortgage that was taken out on this home.
Original Mortgage
$481,124
Outstanding Balance
$436,018
Interest Rate
3.1%
Mortgage Type
FHA
Estimated Equity
$261,730
Purchase Details
Closed on
Jun 15, 2018
Sold by
Tzezairlidis Alexandros
Bought by
Tzezairlidis Michael
Purchase Details
Closed on
Apr 1, 2011
Sold by
Pettesch Johann and Pettesch Mary
Bought by
Tzezairlidis Alexandros
Home Financials for this Owner
Home Financials are based on the most recent Mortgage that was taken out on this home.
Original Mortgage
$272,700
Interest Rate
5.5%
Mortgage Type
FHA
Purchase Details
Closed on
Nov 11, 2009
Sold by
Pettesch Johann and Pettesch Mary
Bought by
Pettesch Johann and Pettesch Mary
Create a Home Valuation Report for This Property
The Home Valuation Report is an in-depth analysis detailing your home's value as well as a comparison with similar homes in the area
Home Values in the Area
Average Home Value in this Area
Purchase History
| Date | Buyer | Sale Price | Title Company |
|---|---|---|---|
| Filho Servulo Alves Dos Santos | $490,000 | Foundation Title Llc | |
| Filho Servulo Alves Dos Sa | $490,000 | Land Title | |
| Tzezairlidis Michael | -- | Chicago Title Company Llc | |
| Tzezairlidis Alexandros | $300,000 | Prestige Title Agency Inc | |
| Pettesch Johann | -- | None Available |
Source: Public Records
Mortgage History
| Date | Status | Borrower | Loan Amount |
|---|---|---|---|
| Open | Filho Servulo Alves Dos Sa | $481,124 | |
| Closed | Filho Servulo Alves Dos Sa | $481,124 | |
| Previous Owner | Tzezairlidis Alexandros | $272,700 |
Source: Public Records
Tax History Compared to Growth
Tax History
| Year | Tax Paid | Tax Assessment Tax Assessment Total Assessment is a certain percentage of the fair market value that is determined by local assessors to be the total taxable value of land and additions on the property. | Land | Improvement |
|---|---|---|---|---|
| 2025 | $12,651 | $56,600 | $20,000 | $36,600 |
| 2024 | $12,265 | $56,600 | $20,000 | $36,600 |
| 2023 | $12,265 | $56,600 | $20,000 | $36,600 |
| 2022 | $11,838 | $56,600 | $20,000 | $36,600 |
| 2021 | $11,551 | $56,600 | $20,000 | $36,600 |
| 2020 | $11,321 | $56,600 | $20,000 | $36,600 |
| 2019 | $11,169 | $56,600 | $20,000 | $36,600 |
| 2018 | $10,979 | $56,600 | $20,000 | $36,600 |
| 2017 | $10,816 | $56,600 | $20,000 | $36,600 |
| 2016 | $10,553 | $56,600 | $20,000 | $36,600 |
| 2015 | $10,378 | $56,600 | $20,000 | $36,600 |
| 2014 | $10,145 | $56,600 | $20,000 | $36,600 |
Source: Public Records
Map
Nearby Homes
- 1114 W Chestnut St
- 10 Sadie Cir
- 7 Sadie Cir Unit 7103
- 753 Lafayette Ave
- 195 Millton Ave
- 809 Caldwell Ave
- 896 Caldwell Ave
- 127 Orchard Terrace
- 160 Elmwood Ave
- 118 Orchard Terrace
- 694 Evergreen Pkwy
- 768 Fairway Dr
- 867 Dona Rd
- 109 Headley Terrace
- 647 Evergreen Pkwy
- 876 Garden St
- 2393 Steuben St
- 412 Tournament6
- 713 Pinehurst Ct Unit 1
- 1010 Falls Terrace
- 812 Niles Rd
- 812 Niles Rd
- 816 Niles Rd
- 1121 W Chestnut St
- 820 Niles Rd
- 1125 W Chestnut St
- 821 Dewey St
- 821 Dewey St Unit 2
- 1105 W Chestnut St
- 824 Niles Rd
- 819 Niles Rd
- 1108 W Chestnut St
- 1104 W Chestnut St
- 825 Dewey St
- 1100 W Chestnut St
- 828 Niles Rd
- 1096 W Chestnut St
- 825 Niles Rd
- 1118 W Chestnut St
- 829 Dewey St