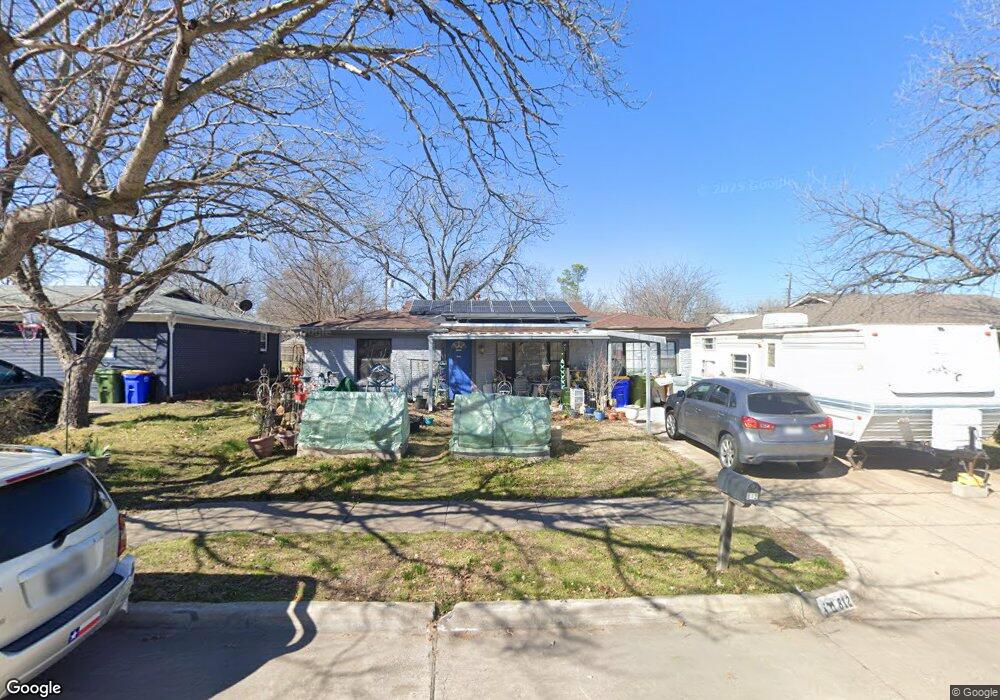
812 Odie Dr Fort Worth, TX 76108
Estimated Value: $229,798 - $264,000
3
Beds
2
Baths
1,426
Sq Ft
$170/Sq Ft
Est. Value
About This Home
This home is located at 812 Odie Dr, Fort Worth, TX 76108 and is currently estimated at $241,950, approximately $169 per square foot. 812 Odie Dr is a home located in Tarrant County with nearby schools including Liberty Elementary School, Brewer Middle School, and Tannahill Intermediate School.
Ownership History
Date
Name
Owned For
Owner Type
Purchase Details
Closed on
Dec 4, 2017
Sold by
Upfall 1 Llc
Bought by
Livingston Aleta M
Current Estimated Value
Home Financials for this Owner
Home Financials are based on the most recent Mortgage that was taken out on this home.
Original Mortgage
$50,000
Outstanding Balance
$42,030
Interest Rate
3.88%
Mortgage Type
New Conventional
Estimated Equity
$199,920
Purchase Details
Closed on
Jul 19, 2017
Sold by
Nam Mi Cha
Bought by
Upfall 1 Llc
Home Financials for this Owner
Home Financials are based on the most recent Mortgage that was taken out on this home.
Original Mortgage
$96,900
Interest Rate
3.91%
Mortgage Type
Purchase Money Mortgage
Purchase Details
Closed on
Feb 6, 2007
Sold by
Deutsche Bank National Trust Co
Bought by
Nam Mi Cha
Purchase Details
Closed on
Aug 1, 2006
Sold by
Chandler Tex and Chandler Tex Melvin
Bought by
Deutsche Bank National Trust Co and Holders Of Morgan Stanley Abs Capital I
Create a Home Valuation Report for This Property
The Home Valuation Report is an in-depth analysis detailing your home's value as well as a comparison with similar homes in the area
Home Values in the Area
Average Home Value in this Area
Purchase History
| Date | Buyer | Sale Price | Title Company |
|---|---|---|---|
| Livingston Aleta M | -- | Lawyers Title | |
| Upfall 1 Llc | -- | None Available | |
| Nam Mi Cha | -- | First American | |
| Deutsche Bank National Trust Co | $75,600 | None Available |
Source: Public Records
Mortgage History
| Date | Status | Borrower | Loan Amount |
|---|---|---|---|
| Open | Livingston Aleta M | $50,000 | |
| Previous Owner | Upfall 1 Llc | $96,900 |
Source: Public Records
Tax History Compared to Growth
Tax History
| Year | Tax Paid | Tax Assessment Tax Assessment Total Assessment is a certain percentage of the fair market value that is determined by local assessors to be the total taxable value of land and additions on the property. | Land | Improvement |
|---|---|---|---|---|
| 2025 | $1,148 | $237,448 | $35,470 | $201,978 |
| 2024 | $1,148 | $237,448 | $35,470 | $201,978 |
| 2023 | $3,852 | $250,868 | $35,470 | $215,398 |
| 2022 | $3,988 | $196,706 | $25,000 | $171,706 |
| 2021 | $3,683 | $176,906 | $25,000 | $151,906 |
| 2020 | $3,372 | $144,817 | $25,000 | $119,817 |
| 2019 | $3,183 | $140,473 | $25,000 | $115,473 |
| 2018 | $2,360 | $100,588 | $12,000 | $88,588 |
| 2017 | $2,282 | $78,078 | $12,000 | $66,078 |
| 2016 | $2,299 | $78,658 | $12,000 | $66,658 |
| 2015 | $1,864 | $64,900 | $10,000 | $54,900 |
| 2014 | $1,864 | $64,900 | $10,000 | $54,900 |
Source: Public Records
Map
Nearby Homes
- 852 Odie Dr
- 867 Odie Dr
- 801 Ala Dr
- 7836 Corina Dr
- 730 S Cherry Ln
- 872 June Dr
- 633 Kimbrough St
- 7805 Whitney Dr
- 537 June Dr
- 501 Odie Dr
- 149 Wilson Cliff Dr
- 8016 Downe Dr
- 8232 Redonda St
- 321 Meadow Park Dr
- 8203 Delmar St
- 7704 Carlos St
- 809 Mirike Dr
- 8316 Sussex St
- 8017 White Settlement Rd
- 911 Rumfield Rd