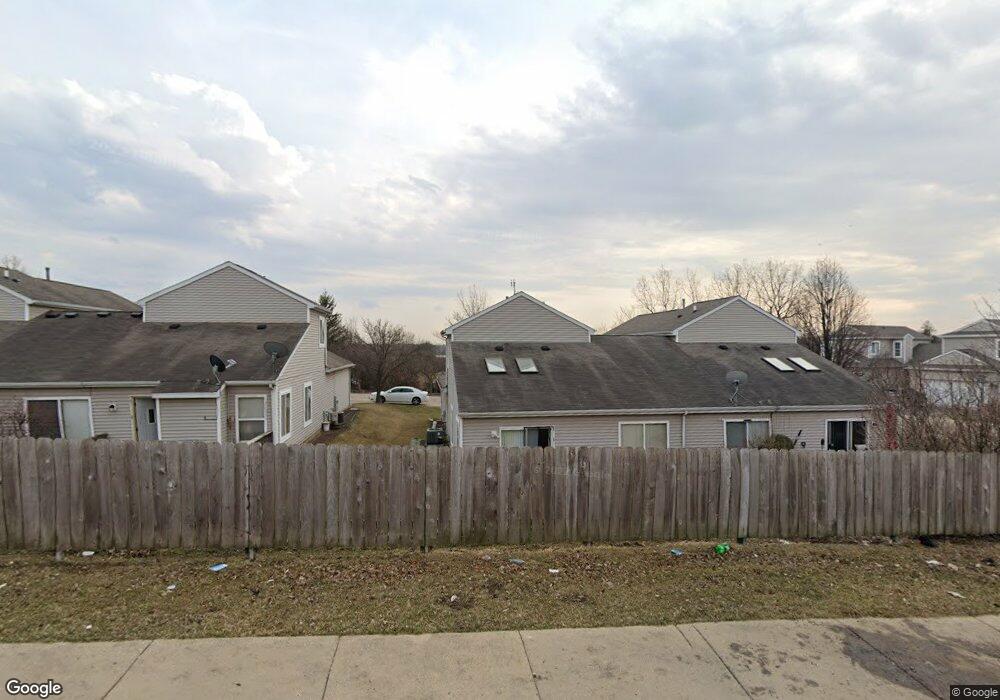
812 Park Bluff Cir Elgin, IL 60120
Bluff City NeighborhoodEstimated Value: $273,158 - $312,000
3
Beds
3
Baths
1,498
Sq Ft
$191/Sq Ft
Est. Value
About This Home
This home is located at 812 Park Bluff Cir, Elgin, IL 60120 and is currently estimated at $286,290, approximately $191 per square foot. 812 Park Bluff Cir is a home located in Cook County with nearby schools including Lords Park Elementary School, Ellis Middle School, and Elgin High School.
Ownership History
Date
Name
Owned For
Owner Type
Purchase Details
Closed on
Aug 18, 2015
Sold by
Ramon Diana M and Ramon Gilberto
Bought by
Mock Dishenda L
Current Estimated Value
Home Financials for this Owner
Home Financials are based on the most recent Mortgage that was taken out on this home.
Original Mortgage
$147,283
Interest Rate
4.62%
Mortgage Type
FHA
Purchase Details
Closed on
May 21, 2010
Sold by
Lumpkins Marla B
Bought by
Ramon Diana M
Home Financials for this Owner
Home Financials are based on the most recent Mortgage that was taken out on this home.
Original Mortgage
$125,600
Interest Rate
5.14%
Mortgage Type
New Conventional
Purchase Details
Closed on
Nov 28, 2000
Sold by
Park Bluff Venture Inc
Bought by
Lumpkins Marla B
Home Financials for this Owner
Home Financials are based on the most recent Mortgage that was taken out on this home.
Original Mortgage
$147,272
Interest Rate
7.8%
Mortgage Type
FHA
Create a Home Valuation Report for This Property
The Home Valuation Report is an in-depth analysis detailing your home's value as well as a comparison with similar homes in the area
Home Values in the Area
Average Home Value in this Area
Purchase History
| Date | Buyer | Sale Price | Title Company |
|---|---|---|---|
| Mock Dishenda L | $150,000 | Attorney | |
| Ramon Diana M | $157,000 | Fort Dearborn Land Title | |
| Lumpkins Marla B | $149,000 | Chicago Title Insurance Co |
Source: Public Records
Mortgage History
| Date | Status | Borrower | Loan Amount |
|---|---|---|---|
| Open | Mock Dishenda L | $147,283 | |
| Previous Owner | Ramon Diana M | $125,600 | |
| Previous Owner | Lumpkins Marla B | $147,272 |
Source: Public Records
Tax History Compared to Growth
Tax History
| Year | Tax Paid | Tax Assessment Tax Assessment Total Assessment is a certain percentage of the fair market value that is determined by local assessors to be the total taxable value of land and additions on the property. | Land | Improvement |
|---|---|---|---|---|
| 2024 | $4,659 | $19,500 | $3,000 | $16,500 |
| 2023 | $4,498 | $19,500 | $3,000 | $16,500 |
| 2022 | $4,498 | $19,500 | $3,000 | $16,500 |
| 2021 | $3,735 | $14,170 | $1,023 | $13,147 |
| 2020 | $3,790 | $14,170 | $1,023 | $13,147 |
| 2019 | $3,829 | $15,922 | $1,023 | $14,899 |
| 2018 | $3,903 | $14,924 | $903 | $14,021 |
| 2017 | $3,911 | $14,924 | $903 | $14,021 |
| 2016 | $3,960 | $14,924 | $903 | $14,021 |
| 2015 | $4,064 | $14,190 | $842 | $13,348 |
| 2014 | $3,955 | $14,190 | $842 | $13,348 |
| 2013 | $3,805 | $14,190 | $842 | $13,348 |
Source: Public Records
Map
Nearby Homes
- 821 Bode Rd Unit 15
- 821 Bode Rd Unit 12
- 764 Terrace Ct Unit A
- 1002 Bruce Dr
- 650 Park St
- 552 E Chicago St
- 899 Carl Ave
- 248 Waverly Dr
- 900 Grand Ave
- 306 S Liberty St
- 144 Hill Ave
- 558 Franklin Blvd
- 445 Lucile Ave
- 1001 Radclyffe Ct Unit C
- 130 Stonehurst Dr
- 453 Addison St
- 456 Addison St
- 444 Prairie St
- 1106 Canterbury Ct Unit A
- 536 Aller Ave
- 812 Park Bluff Cir Unit 812
- 810 Park Bluff Cir
- 816 Park Bluff Cir
- 818 Park Bluff Cir
- 822 Park Bluff Cir
- 822 Park Bluff Cir Unit 822
- 824 Park Bluff Cir
- 824 Park Bluff Cir Unit 824
- 807 Park Bluff Cir
- 809 Park Bluff Cir
- 803 Park Bluff Cir
- 801 Park Bluff Cir
- 821 Park Bluff Cir
- 828 Park Bluff Cir
- 823 Park Bluff Cir
- 821 Bode Rd Unit 7
- 821 Bode Rd Unit 9
- 821 Bode Rd Unit 10
- 821 Bode Rd Unit 1
- 821 Bode Rd Unit 13