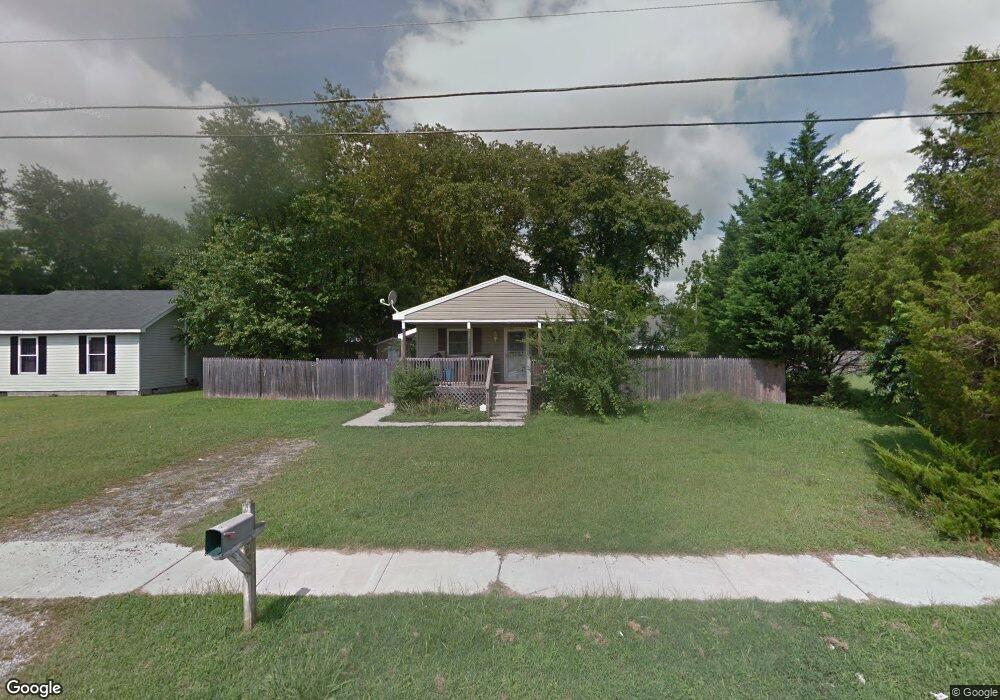
812 Price Rd Salisbury, MD 21801
North Salisbury NeighborhoodEstimated Value: $170,000 - $217,000
3
Beds
2
Baths
960
Sq Ft
$211/Sq Ft
Est. Value
About This Home
This home is located at 812 Price Rd, Salisbury, MD 21801 and is currently estimated at $202,649, approximately $211 per square foot. 812 Price Rd is a home located in Wicomico County with nearby schools including Charles H. Chipman Elementary School, Glen Avenue Elementary School, and Salisbury Middle School.
Ownership History
Date
Name
Owned For
Owner Type
Purchase Details
Closed on
May 4, 2017
Sold by
Wilgus Edward Q
Bought by
Cole Michael and Ballard Patricia
Current Estimated Value
Home Financials for this Owner
Home Financials are based on the most recent Mortgage that was taken out on this home.
Original Mortgage
$93,180
Outstanding Balance
$47,675
Interest Rate
3.62%
Mortgage Type
FHA
Estimated Equity
$154,974
Purchase Details
Closed on
Nov 9, 2016
Sold by
Walker Shirley and Wallop Lena
Bought by
Wilgus Edward Q
Purchase Details
Closed on
Apr 17, 2009
Sold by
Walker Shirley
Bought by
Walker Sandra D
Purchase Details
Closed on
Dec 20, 2001
Sold by
Davis David E and Davis Angela M
Bought by
Walker Shirley
Purchase Details
Closed on
Feb 6, 1998
Sold by
Habitat On Maryland'S Lower Shore
Bought by
Davis David E and Davis Angela M
Create a Home Valuation Report for This Property
The Home Valuation Report is an in-depth analysis detailing your home's value as well as a comparison with similar homes in the area
Home Values in the Area
Average Home Value in this Area
Purchase History
| Date | Buyer | Sale Price | Title Company |
|---|---|---|---|
| Cole Michael | $94,900 | Mid Atlantic Title & Escrow | |
| Wilgus Edward Q | $35,000 | Mid Atlantic Title & Escrow | |
| Walker Sandra D | -- | -- | |
| Walker Shirley | $50,600 | -- | |
| Davis David E | $29,500 | -- |
Source: Public Records
Mortgage History
| Date | Status | Borrower | Loan Amount |
|---|---|---|---|
| Open | Cole Michael | $93,180 | |
| Closed | Davis David E | -- |
Source: Public Records
Tax History Compared to Growth
Tax History
| Year | Tax Paid | Tax Assessment Tax Assessment Total Assessment is a certain percentage of the fair market value that is determined by local assessors to be the total taxable value of land and additions on the property. | Land | Improvement |
|---|---|---|---|---|
| 2025 | $1,096 | $161,333 | $0 | $0 |
| 2024 | $1,096 | $138,867 | $0 | $0 |
| 2023 | $972 | $116,400 | $13,500 | $102,900 |
| 2022 | $950 | $108,267 | $0 | $0 |
| 2021 | $967 | $100,133 | $0 | $0 |
| 2020 | $967 | $92,000 | $13,500 | $78,500 |
| 2019 | $935 | $83,500 | $0 | $0 |
| 2018 | $898 | $75,000 | $0 | $0 |
| 2017 | $849 | $66,500 | $0 | $0 |
| 2016 | -- | $66,500 | $0 | $0 |
| 2015 | $1,017 | $66,500 | $0 | $0 |
| 2014 | $1,017 | $75,300 | $0 | $0 |
Source: Public Records
Map
Nearby Homes
- 902 Lake St
- 731 N Westover Dr
- 735 N Westover Dr
- 0 Morris St
- 665 West Rd
- 403 Rose St
- 1201 Kiowa Ave
- 311 W Philadelphia Ave
- 1107 Mineola Ave
- 309 W London Ave
- 313 W London Ave
- 1103 Tuscola Ave
- 304 Brooklyn Ave
- 400 Lake St
- LOT D4 International Dr
- 1109 Shawnee Ave
- 346 Delaware Ave
- 109 New York Ave
- 106 W Philadelphia Ave
- 320 Park Ave