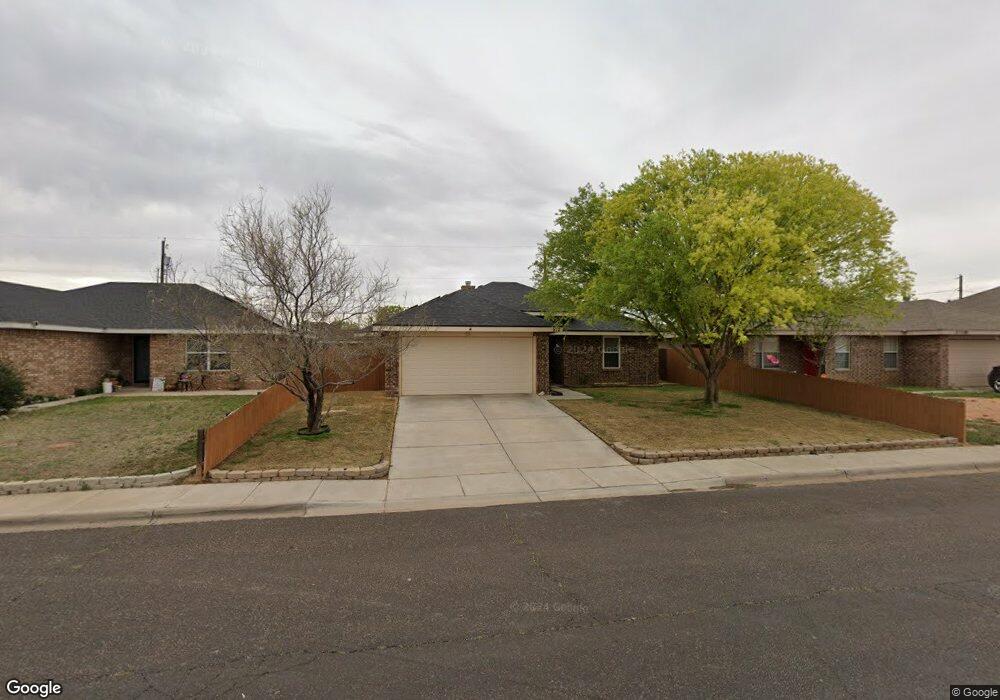
812 Purdue St Odessa, TX 79765
East Park NeighborhoodEstimated Value: $234,904 - $265,000
--
Bed
--
Bath
1,364
Sq Ft
$183/Sq Ft
Est. Value
About This Home
This home is located at 812 Purdue St, Odessa, TX 79765 and is currently estimated at $248,976, approximately $182 per square foot. 812 Purdue St is a home with nearby schools including Lee Buice Elementary School, Wilson & Young Medal of Honor Middle School, and Permian High School.
Ownership History
Date
Name
Owned For
Owner Type
Purchase Details
Closed on
May 6, 2019
Sold by
Sosa Jesus and Sosa Jesse
Bought by
Sosa Jesus and Sosa Delia
Current Estimated Value
Home Financials for this Owner
Home Financials are based on the most recent Mortgage that was taken out on this home.
Original Mortgage
$115,150
Outstanding Balance
$74,754
Interest Rate
4%
Mortgage Type
New Conventional
Estimated Equity
$174,222
Purchase Details
Closed on
Dec 22, 2011
Sold by
Sentinel Development Corporation
Bought by
Sosa Jesse
Home Financials for this Owner
Home Financials are based on the most recent Mortgage that was taken out on this home.
Original Mortgage
$131,577
Interest Rate
4.25%
Mortgage Type
FHA
Purchase Details
Closed on
Jul 11, 2011
Sold by
Deter Harry R
Bought by
Sentinel Development Corporation
Home Financials for this Owner
Home Financials are based on the most recent Mortgage that was taken out on this home.
Original Mortgage
$100,860
Interest Rate
4.55%
Mortgage Type
Purchase Money Mortgage
Create a Home Valuation Report for This Property
The Home Valuation Report is an in-depth analysis detailing your home's value as well as a comparison with similar homes in the area
Home Values in the Area
Average Home Value in this Area
Purchase History
| Date | Buyer | Sale Price | Title Company |
|---|---|---|---|
| Sosa Jesus | -- | Servicelink | |
| Sosa Jesse | -- | Basin Abstract & Title | |
| Sentinel Development Corporation | -- | Basin Abstract & Title |
Source: Public Records
Mortgage History
| Date | Status | Borrower | Loan Amount |
|---|---|---|---|
| Open | Sosa Jesus | $115,150 | |
| Closed | Sosa Jesse | $131,577 | |
| Previous Owner | Sentinel Development Corporation | $100,860 |
Source: Public Records
Tax History Compared to Growth
Tax History
| Year | Tax Paid | Tax Assessment Tax Assessment Total Assessment is a certain percentage of the fair market value that is determined by local assessors to be the total taxable value of land and additions on the property. | Land | Improvement |
|---|---|---|---|---|
| 2024 | $2,865 | $249,755 | $16,830 | $232,925 |
| 2023 | $2,634 | $240,794 | $16,830 | $223,964 |
| 2022 | $4,912 | $212,632 | $19,206 | $193,426 |
| 2021 | $4,841 | $205,200 | $19,206 | $185,994 |
| 2020 | $4,623 | $199,347 | $12,210 | $187,137 |
| 2019 | $4,719 | $192,295 | $12,210 | $180,085 |
| 2018 | $4,097 | $174,012 | $12,210 | $161,802 |
| 2017 | $3,740 | $164,219 | $12,210 | $152,009 |
| 2016 | $3,646 | $164,219 | $12,210 | $152,009 |
| 2015 | $2,320 | $164,219 | $12,210 | $152,009 |
| 2014 | $2,320 | $161,545 | $12,210 | $149,335 |
Source: Public Records
Map
Nearby Homes
- 809 Duke Ave
- 916 Duke Ave
- 668 Purdue St
- 933 Big Easy St
- 919 E 89th St
- 906 Yancy St
- 1207 Cajun St
- 1212 Big Easy St
- 1200 E 89th St
- 1110 Yancy St
- 8626 Dublin Ave
- 413 Boxelder Dr
- 8800 Dublin Ave
- 1314 E 89th St
- 305 Staghorn Dr
- 9021 Desert Ave
- 1317 Big Easy St
- 7 Iron Wood Ct
- 1331 Bourbon St
- 14 Iron Wood Ct