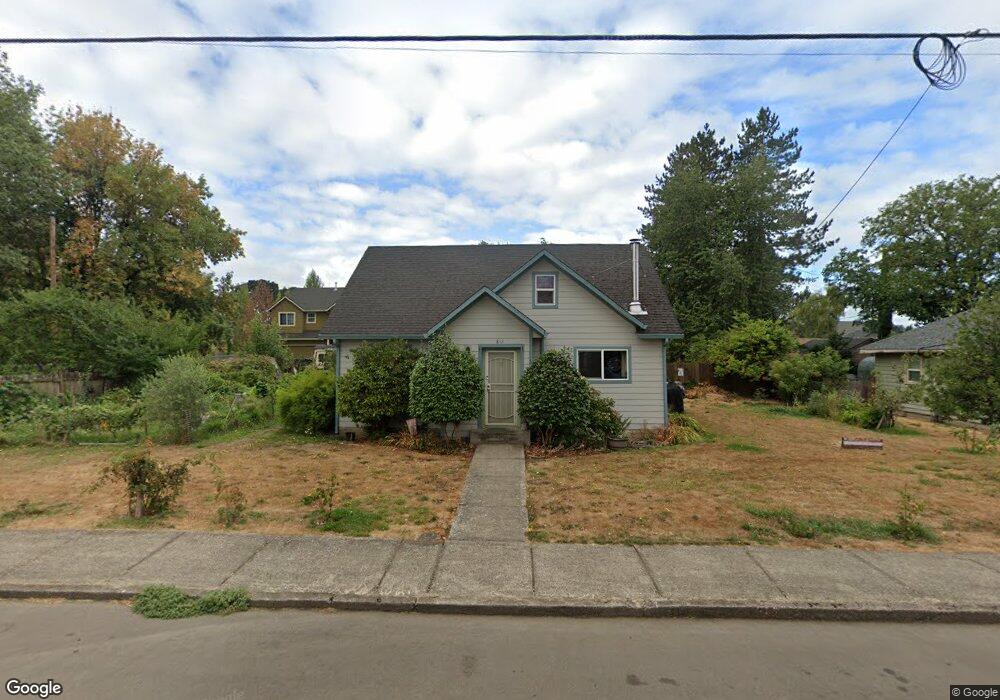
812 S Bridge St Sheridan, OR 97378
Estimated Value: $280,000 - $333,030
3
Beds
1
Bath
1,513
Sq Ft
$205/Sq Ft
Est. Value
About This Home
This home is located at 812 S Bridge St, Sheridan, OR 97378 and is currently estimated at $310,258, approximately $205 per square foot. 812 S Bridge St is a home located in Yamhill County with nearby schools including Faulconer-Chapman School, Sheridan High School, and Sheridan Allprep Academy.
Ownership History
Date
Name
Owned For
Owner Type
Purchase Details
Closed on
Dec 10, 2014
Sold by
Fullmer Sharon D and Walkefield Sharon D
Bought by
Fullmer Sharon D
Current Estimated Value
Home Financials for this Owner
Home Financials are based on the most recent Mortgage that was taken out on this home.
Original Mortgage
$121,300
Outstanding Balance
$92,478
Interest Rate
3.95%
Mortgage Type
New Conventional
Estimated Equity
$217,780
Purchase Details
Closed on
May 31, 2007
Sold by
Kim Charles and Kim Mikyung L
Bought by
Wakefield Sharon D
Home Financials for this Owner
Home Financials are based on the most recent Mortgage that was taken out on this home.
Original Mortgage
$134,100
Interest Rate
6.12%
Mortgage Type
Purchase Money Mortgage
Purchase Details
Closed on
Apr 11, 2006
Sold by
Gutbrod Marjorie J
Bought by
Kim Charles and Kim Mikyung L
Home Financials for this Owner
Home Financials are based on the most recent Mortgage that was taken out on this home.
Original Mortgage
$98,625
Interest Rate
6.25%
Mortgage Type
Purchase Money Mortgage
Create a Home Valuation Report for This Property
The Home Valuation Report is an in-depth analysis detailing your home's value as well as a comparison with similar homes in the area
Home Values in the Area
Average Home Value in this Area
Purchase History
| Date | Buyer | Sale Price | Title Company |
|---|---|---|---|
| Fullmer Sharon D | -- | First American | |
| Wakefield Sharon D | $149,000 | Ticor Title Insurance Co | |
| Kim Charles | $131,500 | Ticor Title Insurance Co |
Source: Public Records
Mortgage History
| Date | Status | Borrower | Loan Amount |
|---|---|---|---|
| Open | Fullmer Sharon D | $121,300 | |
| Closed | Wakefield Sharon D | $134,100 | |
| Previous Owner | Kim Charles | $98,625 |
Source: Public Records
Tax History Compared to Growth
Tax History
| Year | Tax Paid | Tax Assessment Tax Assessment Total Assessment is a certain percentage of the fair market value that is determined by local assessors to be the total taxable value of land and additions on the property. | Land | Improvement |
|---|---|---|---|---|
| 2025 | $2,130 | $157,153 | -- | -- |
| 2024 | $1,956 | $152,576 | -- | -- |
| 2023 | $1,900 | $148,132 | $0 | $0 |
| 2022 | $1,847 | $143,817 | $0 | $0 |
| 2021 | $2,091 | $139,628 | $0 | $0 |
| 2020 | $2,020 | $135,561 | $0 | $0 |
| 2019 | $1,984 | $131,613 | $0 | $0 |
| 2018 | $1,928 | $127,780 | $0 | $0 |
| 2017 | $1,893 | $124,058 | $0 | $0 |
| 2016 | $1,838 | $120,445 | $0 | $0 |
| 2015 | $1,760 | $116,939 | $0 | $0 |
| 2014 | $1,709 | $113,534 | $0 | $0 |
Source: Public Records
Map
Nearby Homes
- 740 SE Alicia St
- 240 SW Jefferson St
- 518 S Bridge St
- 204 SW Water St
- 0 Highway 18 (Ta 635db00400)
- 243 SE Harney St
- 419 SE Sheridan Rd
- 503 SE Sheridan Rd Unit 8
- 515 SE Sheridan Rd
- 515 SE Sheridan Rd Unit 6
- 370 NW Yamhill St
- 634 E Main St
- 617 SW Monroe St
- 328 NW Sherman St
- 119 NW Sherman St
- 735 SW Mill St
- 347 NE Oak St
- 0 NW Viola St
- 245 NE Balm St
- 240 NW Sagan Loop
- 806 S Bridge St
- 818 S Bridge St
- S Bridge St (Off Of)
- 153 SW Chapman St Unit 1
- 153 SW Chapman St
- 740 S Bridge St
- 809 S Bridge St
- 730 S Bridge St
- 811 S Bridge St
- 819 S Bridge St
- 141 SW Chapman St
- 747 S Bridge St
- 825 S Bridge St
- 844 S Bridge St
- 166 SW Chapman St
- 718 S Bridge St
- 725 S Bridge St
- 829 S Bridge St
- 114 SW Jefferson St
- 735 S Bridge St