Estimated Value: $109,000 - $138,000
2
Beds
1
Bath
932
Sq Ft
$137/Sq Ft
Est. Value
About This Home
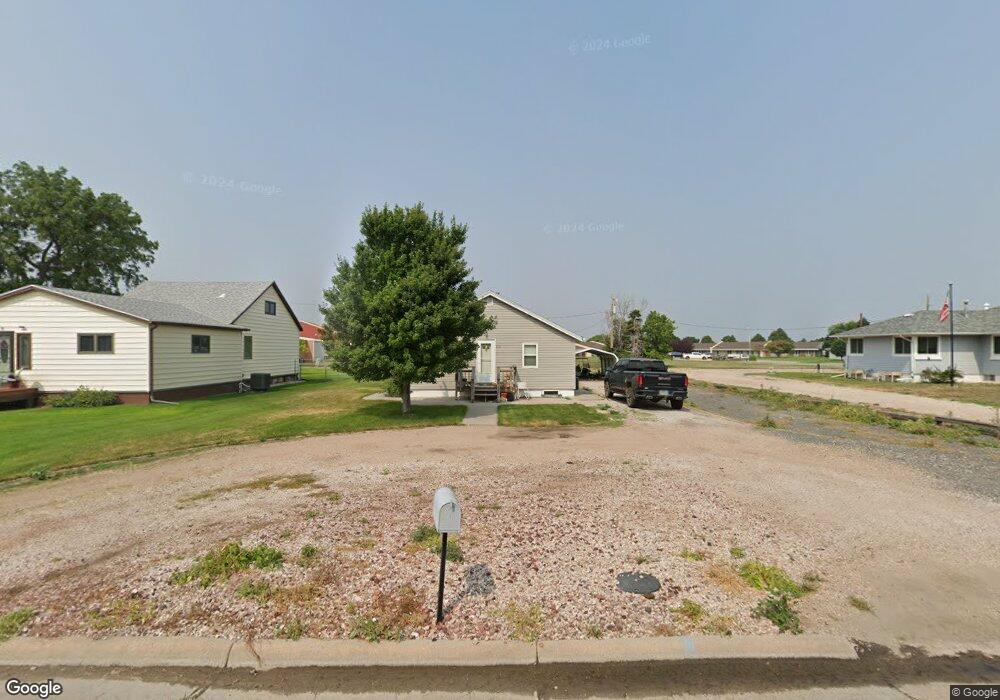
This home is located at 812 Sherman Ave, Grant, NE 69140 and is currently estimated at $127,667, approximately $136 per square foot. 812 Sherman Ave is a home located in Perkins County with nearby schools including Perkins County Elementary School and Perkins County Junior/Senior High School.
Ownership History
Date
Name
Owned For
Owner Type
Purchase Details
Closed on
Mar 21, 2022
Sold by
Tanner Collins
Bought by
Heimann Emily
Current Estimated Value
Home Financials for this Owner
Home Financials are based on the most recent Mortgage that was taken out on this home.
Original Mortgage
$110,101
Outstanding Balance
$102,787
Interest Rate
4.16%
Mortgage Type
New Conventional
Estimated Equity
$24,880
Purchase Details
Closed on
Jan 15, 2021
Sold by
Heather Malmkar
Bought by
Tanner Collins
Home Financials for this Owner
Home Financials are based on the most recent Mortgage that was taken out on this home.
Original Mortgage
$10,637
Interest Rate
2.67%
Mortgage Type
New Conventional
Purchase Details
Closed on
Oct 31, 2011
Bought by
Mostek Dennis
Create a Home Valuation Report for This Property
The Home Valuation Report is an in-depth analysis detailing your home's value as well as a comparison with similar homes in the area
Home Values in the Area
Average Home Value in this Area
Purchase History
| Date | Buyer | Sale Price | Title Company |
|---|---|---|---|
| Heimann Emily | $110,000 | New Title Company Name | |
| Tanner Collins | $62,500 | -- | |
| Mostek Dennis | $48,000 | -- |
Source: Public Records
Mortgage History
| Date | Status | Borrower | Loan Amount |
|---|---|---|---|
| Open | Heimann Emily | $110,101 | |
| Previous Owner | Tanner Collins | $10,637 | |
| Closed | Heimann Emily | $5,000 |
Source: Public Records
Tax History Compared to Growth
Tax History
| Year | Tax Paid | Tax Assessment Tax Assessment Total Assessment is a certain percentage of the fair market value that is determined by local assessors to be the total taxable value of land and additions on the property. | Land | Improvement |
|---|---|---|---|---|
| 2025 | $876 | $94,568 | $10,906 | $83,662 |
| 2024 | $876 | $87,123 | $10,906 | $76,217 |
| 2023 | $1,122 | $87,123 | $10,906 | $76,217 |
| 2022 | $914 | $62,526 | $10,906 | $51,620 |
| 2021 | $1,021 | $68,971 | $10,906 | $58,065 |
| 2020 | $853 | $59,000 | $8,036 | $50,964 |
| 2019 | $756 | $59,000 | $8,036 | $50,964 |
| 2018 | $718 | $59,000 | $8,036 | $50,964 |
| 2017 | $765 | $60,000 | $8,036 | $51,964 |
| 2016 | $619 | $48,000 | $8,036 | $39,964 |
| 2015 | $633 | $48,000 | $8,036 | $39,964 |
| 2014 | $723 | $48,000 | $8,036 | $39,964 |
Source: Public Records
Map
Nearby Homes
- 840 Elm Ave
- 32620 Hwy 23
- 75315 Road 330
- 0 Road 769
- 105 N Forbes Ave
- 302 S Ames Ave
- 212 S Ford Ave
- 412 S Ford Ave
- 306 Robinson St
- 0 Road 324
- 75415 Road 337
- 290 W Road I S
- 181 Lawrence Rd
- 115 Spy Glass Cir
- Trs 9-10-11-12 Mueller & Mueller Corp
- 306 Libmax Ln
- 308 Pony Express Ln
- 312 Pony Express Ln
- 301 Chuckwagon Rd
- 0 Tbd 324 Ave
- 804 Sherman Ave
- 802 Sherman Ave
- 820 Sherman Ave
- 821 Sherman Ave
- 835 Sherman Ave
- 744 Sherman Ave
- 829 Sherman Ave
- 826 Sherman Ave
- 317 W 8th St
- 316 W 8th St
- 831 Sherman Ave
- 839 Sherman Ave
- 880 Sherman Ave
- 725 Sherman Ave
- 820 Garfield Ave
- 826 Garfield Ave
- 721 Sherman Ave
- 3 Westview Dr
- 832 Garfield Ave
- 841 Sherman Ave