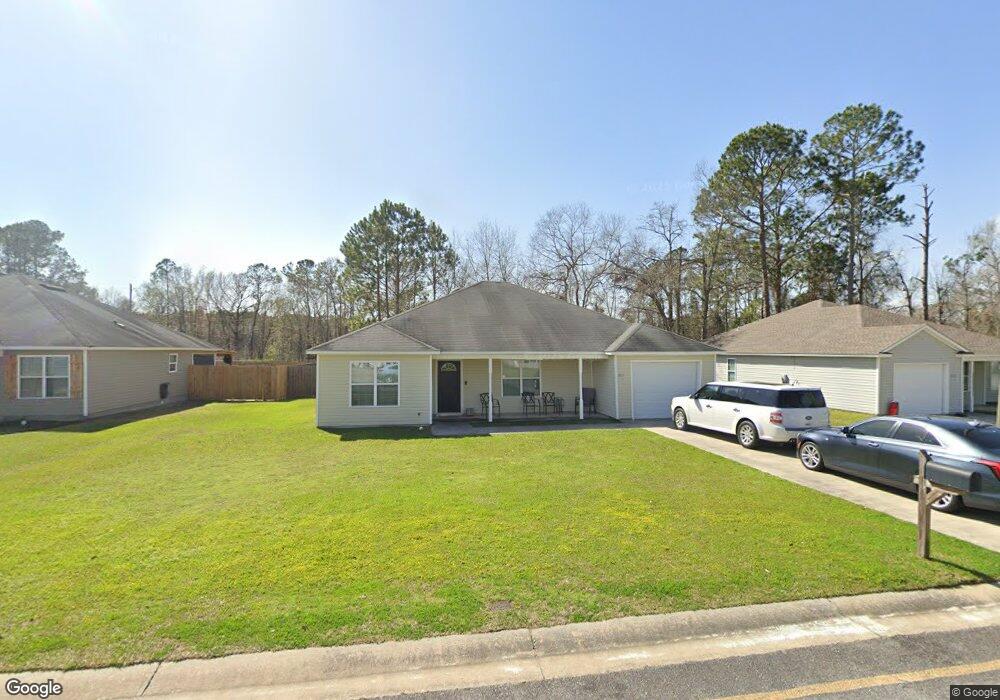
812 Summer Ln Hahira, GA 31632
Estimated Value: $217,000 - $240,000
3
Beds
2
Baths
1,627
Sq Ft
$140/Sq Ft
Est. Value
About This Home
This home is located at 812 Summer Ln, Hahira, GA 31632 and is currently estimated at $227,469, approximately $139 per square foot. 812 Summer Ln is a home located in Lowndes County with nearby schools including Hahira Elementary School, Hahira Middle School, and Lowndes High School.
Ownership History
Date
Name
Owned For
Owner Type
Purchase Details
Closed on
May 31, 2019
Sold by
Gravitt Todd R
Bought by
Lozano Diana C
Current Estimated Value
Home Financials for this Owner
Home Financials are based on the most recent Mortgage that was taken out on this home.
Original Mortgage
$103,098
Outstanding Balance
$90,648
Interest Rate
4.1%
Mortgage Type
VA
Estimated Equity
$136,821
Purchase Details
Closed on
Mar 1, 2006
Sold by
Mdm Construction Llc
Bought by
Gravitt Todd R and Gravitt Carriann M
Home Financials for this Owner
Home Financials are based on the most recent Mortgage that was taken out on this home.
Original Mortgage
$25,100
Interest Rate
5.81%
Mortgage Type
New Conventional
Purchase Details
Closed on
Apr 5, 2005
Sold by
Nelco Inc
Bought by
Mdm Construction Llc
Purchase Details
Closed on
Mar 24, 2005
Sold by
Drc Development Llc
Bought by
Nelco Inc
Create a Home Valuation Report for This Property
The Home Valuation Report is an in-depth analysis detailing your home's value as well as a comparison with similar homes in the area
Home Values in the Area
Average Home Value in this Area
Purchase History
| Date | Buyer | Sale Price | Title Company |
|---|---|---|---|
| Lozano Diana C | $105,000 | -- | |
| Gravitt Todd R | $112,300 | -- | |
| Mdm Construction Llc | $132,000 | -- | |
| Nelco Inc | $1,687,500 | -- |
Source: Public Records
Mortgage History
| Date | Status | Borrower | Loan Amount |
|---|---|---|---|
| Open | Lozano Diana C | $103,098 | |
| Previous Owner | Gravitt Todd R | $25,100 | |
| Previous Owner | Gravitt Todd R | $81,537 |
Source: Public Records
Tax History Compared to Growth
Tax History
| Year | Tax Paid | Tax Assessment Tax Assessment Total Assessment is a certain percentage of the fair market value that is determined by local assessors to be the total taxable value of land and additions on the property. | Land | Improvement |
|---|---|---|---|---|
| 2024 | $2,277 | $83,008 | $10,000 | $73,008 |
| 2023 | $2,185 | $65,710 | $10,000 | $55,710 |
| 2022 | $1,465 | $47,066 | $10,000 | $37,066 |
| 2021 | $1,476 | $47,066 | $10,000 | $37,066 |
| 2020 | $1,300 | $40,888 | $10,000 | $30,888 |
| 2019 | $1,410 | $43,977 | $10,000 | $33,977 |
| 2018 | $1,423 | $43,977 | $10,000 | $33,977 |
| 2017 | $1,443 | $43,977 | $10,000 | $33,977 |
| 2016 | $1,446 | $43,977 | $10,000 | $33,977 |
| 2015 | $1,394 | $43,977 | $10,000 | $33,977 |
| 2014 | $1,419 | $43,977 | $10,000 | $33,977 |
Source: Public Records
Map
Nearby Homes
- 819 Kristen Ln
- 824 Danielle Way
- 1601 Beverly Ln
- The Belfort Plan at Phillips Place
- The Ozark Plan at Phillips Place
- 6680 Brookridge Dr
- 497 Bryson Cir
- 489 Bryson Cir
- 6672 Brookridge Dr
- 3001 Houser Way
- 209 Orvis Ln
- 411 Judy Ann Dr
- 6628 Brookridge Dr
- 6622 Brookridge Dr
- 6616 Brookridge Dr
- 6610 Brookridge Dr
- 3033 Reynolda Dr
- 605 S Nelson St
- 750 Georgia 122
- The Walker Plan at Reynolda Place