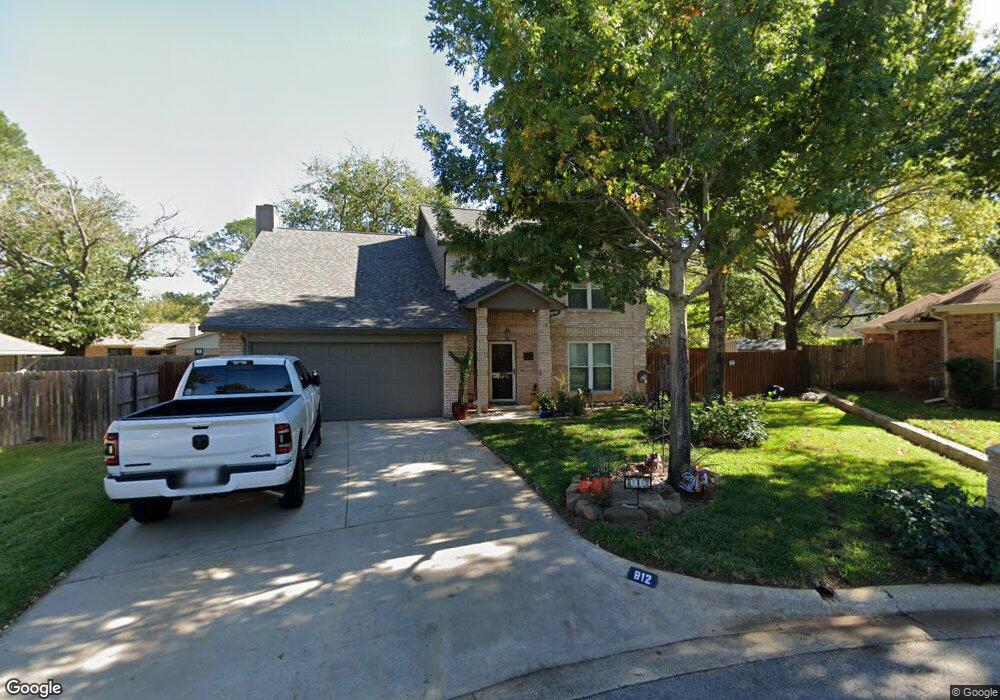
812 Trail Edge Dr Grapevine, TX 76051
Estimated Value: $493,443 - $586,000
4
Beds
2
Baths
2,002
Sq Ft
$266/Sq Ft
Est. Value
About This Home
This home is located at 812 Trail Edge Dr, Grapevine, TX 76051 and is currently estimated at $533,361, approximately $266 per square foot. 812 Trail Edge Dr is a home located in Tarrant County with nearby schools including Silver Lake Elementary School, Grapevine Middle, and Southlake Montessori.
Ownership History
Date
Name
Owned For
Owner Type
Purchase Details
Closed on
Nov 13, 2003
Sold by
Wood Mark John and Wood Chris Abbott
Bought by
Martinez Jesus and Martinez Ginger
Current Estimated Value
Home Financials for this Owner
Home Financials are based on the most recent Mortgage that was taken out on this home.
Original Mortgage
$132,000
Outstanding Balance
$60,898
Interest Rate
5.93%
Mortgage Type
Purchase Money Mortgage
Estimated Equity
$472,463
Purchase Details
Closed on
Dec 16, 1996
Sold by
Keaffaber Inc
Bought by
Wood Mark John and Abbott Christine P
Home Financials for this Owner
Home Financials are based on the most recent Mortgage that was taken out on this home.
Original Mortgage
$122,050
Interest Rate
7.71%
Purchase Details
Closed on
Jan 29, 1996
Sold by
Vista Partners
Bought by
Keaffaber Inc
Home Financials for this Owner
Home Financials are based on the most recent Mortgage that was taken out on this home.
Original Mortgage
$80,000
Interest Rate
7.19%
Create a Home Valuation Report for This Property
The Home Valuation Report is an in-depth analysis detailing your home's value as well as a comparison with similar homes in the area
Home Values in the Area
Average Home Value in this Area
Purchase History
| Date | Buyer | Sale Price | Title Company |
|---|---|---|---|
| Martinez Jesus | -- | American Title Mesquite | |
| Wood Mark John | -- | Trinity Western Title Co | |
| Keaffaber Inc | -- | Trinity Western Title Co |
Source: Public Records
Mortgage History
| Date | Status | Borrower | Loan Amount |
|---|---|---|---|
| Open | Martinez Jesus | $132,000 | |
| Previous Owner | Wood Mark John | $122,050 | |
| Previous Owner | Keaffaber Inc | $80,000 |
Source: Public Records
Tax History Compared to Growth
Tax History
| Year | Tax Paid | Tax Assessment Tax Assessment Total Assessment is a certain percentage of the fair market value that is determined by local assessors to be the total taxable value of land and additions on the property. | Land | Improvement |
|---|---|---|---|---|
| 2025 | $1,844 | $453,000 | $85,000 | $368,000 |
| 2024 | $1,844 | $453,000 | $85,000 | $368,000 |
| 2023 | $7,331 | $465,500 | $75,000 | $390,500 |
| 2022 | $7,875 | $409,366 | $50,000 | $359,366 |
| 2021 | $7,857 | $361,378 | $50,000 | $311,378 |
| 2020 | $7,652 | $347,896 | $50,000 | $297,896 |
| 2019 | $7,490 | $337,146 | $50,000 | $287,146 |
| 2018 | $1,775 | $298,593 | $50,000 | $248,593 |
| 2017 | $6,461 | $308,780 | $50,000 | $258,780 |
| 2016 | $5,874 | $254,000 | $50,000 | $204,000 |
| 2015 | $4,881 | $238,800 | $25,000 | $213,800 |
| 2014 | $4,881 | $238,800 | $25,000 | $213,800 |
Source: Public Records
Map
Nearby Homes
- 1201 Circle View Ct
- 841 Meadow Bend Loop W
- 1002 Meadow Bend Loop N
- 1507 Country Forest Ct
- 305 Tillery Cir
- 1508 Bennington Ct
- 460 Caviness Dr
- 517 Yellowstone Dr
- 218 W Peach St
- 6011 Laurel Ln
- 6007 Laurel Ln
- 1323 Dublin St
- 1626 Choteau Cir
- 2081 Holt Way
- 1916 Everglade Ct
- 1641 Choteau Cir
- 309 N Main St
- 2092 Holt Way
- 2093 Holt Way
- 1654 Choteau Cir
- 816 Trail Edge Dr
- 809 N Lucas Dr
- 815 N Lucas Dr
- 1205 Circle View Ct
- 803 N Lucas Dr
- 1202 Circle View Ct
- 732 Forest St
- 735 N Lucas Dr
- 1209 Circle View Ct
- 900 Trail Edge Dr
- 903 N Lucas Dr
- 1206 Circle View Ct
- 728 Forest St
- 1201 Sandhurst Ct
- 729 N Lucas Dr
- 1213 Circle View Ct
- 816 N Lucas Dr
- 810 N Lucas Dr
- 904 Trail Edge Dr
- 804 N Lucas Dr