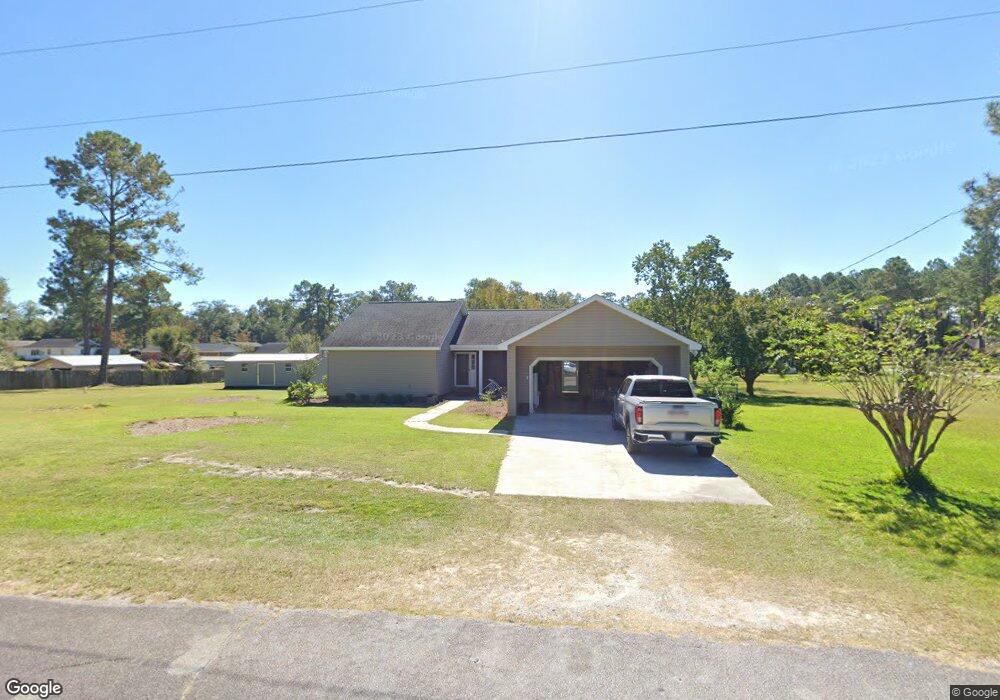
812 Varnview Dr Waycross, GA 31501
Estimated Value: $204,000 - $261,000
3
Beds
2
Baths
1,694
Sq Ft
$133/Sq Ft
Est. Value
About This Home
This home is located at 812 Varnview Dr, Waycross, GA 31501 and is currently estimated at $225,153, approximately $132 per square foot. 812 Varnview Dr is a home located in Ware County with nearby schools including Center Elementary School, Waycross Middle School, and Ware County High School.
Ownership History
Date
Name
Owned For
Owner Type
Purchase Details
Closed on
Aug 10, 2022
Sold by
Hinely William Stephen
Bought by
Hinely William Stephen and Hinely Jessica Christie
Current Estimated Value
Purchase Details
Closed on
May 13, 2020
Sold by
Trotter Lucinda M
Bought by
Hinely William S and Gibson Jessica
Home Financials for this Owner
Home Financials are based on the most recent Mortgage that was taken out on this home.
Original Mortgage
$140,000
Interest Rate
3.3%
Mortgage Type
New Conventional
Purchase Details
Closed on
Aug 16, 2000
Sold by
Sowell Robert J and Sowell Lu
Bought by
Trotter Lucinda M
Purchase Details
Closed on
Nov 18, 1988
Bought by
Sowell Robert J
Create a Home Valuation Report for This Property
The Home Valuation Report is an in-depth analysis detailing your home's value as well as a comparison with similar homes in the area
Purchase History
| Date | Buyer | Sale Price | Title Company |
|---|---|---|---|
| Hinely William Stephen | -- | -- | |
| Hinely William S | $140,000 | -- | |
| Trotter Lucinda M | $90,000 | -- | |
| Sowell Robert J | $52,500 | -- |
Source: Public Records
Mortgage History
| Date | Status | Borrower | Loan Amount |
|---|---|---|---|
| Previous Owner | Hinely William S | $140,000 |
Source: Public Records
Tax History
| Year | Tax Paid | Tax Assessment Tax Assessment Total Assessment is a certain percentage of the fair market value that is determined by local assessors to be the total taxable value of land and additions on the property. | Land | Improvement |
|---|---|---|---|---|
| 2025 | $1,336 | $95,134 | $7,620 | $87,514 |
| 2024 | $1,336 | $84,115 | $7,620 | $76,495 |
| 2023 | $1,363 | $71,866 | $6,184 | $65,682 |
| 2022 | $1,508 | $71,866 | $6,184 | $65,682 |
| 2021 | $1,588 | $56,006 | $6,184 | $49,822 |
| 2020 | $1,274 | $51,910 | $5,806 | $46,104 |
| 2019 | $1,274 | $44,226 | $5,806 | $38,420 |
| 2018 | $1,260 | $42,689 | $5,806 | $36,883 |
| 2017 | $1,258 | $42,689 | $5,806 | $36,883 |
| 2016 | $1,258 | $42,689 | $5,806 | $36,883 |
| 2015 | $1,270 | $42,689 | $5,806 | $36,883 |
| 2014 | $1,268 | $42,689 | $5,806 | $36,883 |
| 2013 | -- | $42,689 | $5,806 | $36,883 |
Source: Public Records
Map
Nearby Homes
- 2784 Autumn Ridge Ln
- 901 E Waring St
- 2218 Riverside Ave
- 2109 Neal St
- 904 Golfview Dr
- 702 E Waring St
- 606 Poplar St
- 2312 Spurgeon St
- 371 Cherokee Ave
- 607 Linden Dr
- 0 Ash Dr
- 1509 Bethune St
- 601 Community Dr
- 1301 Riverside Ave
- 0000 Lejune Rd
- 1500 Clough St
- 2120 Tebeau St
- 240 E Blackshear Ave
- 2202 Pioneer St
- 1407 Hazel St
- 0 Varnview Dr
- 811 Orchard Ln
- 816 Varnview Dr
- 813 Orchard Ln
- 809 Orchard Ln
- 815 Orchard Ln
- 817 Orchard Ln
- 2502 Hilltop Cir
- 812 Orchard Ln
- 819 Orchard Ln
- 814 Orchard Ln
- 810 Orchard Ln
- 816 Orchard Ln
- 2401 Madison Ave
- 2708 Autumn Ridge Ln
- 818 Orchard Ln
- 821 Orchard Ln
- 820 Orchard Ln
- 822 Varnview Dr
- 2503 Hilltop Cir
Your Personal Tour Guide
Ask me questions while you tour the home.