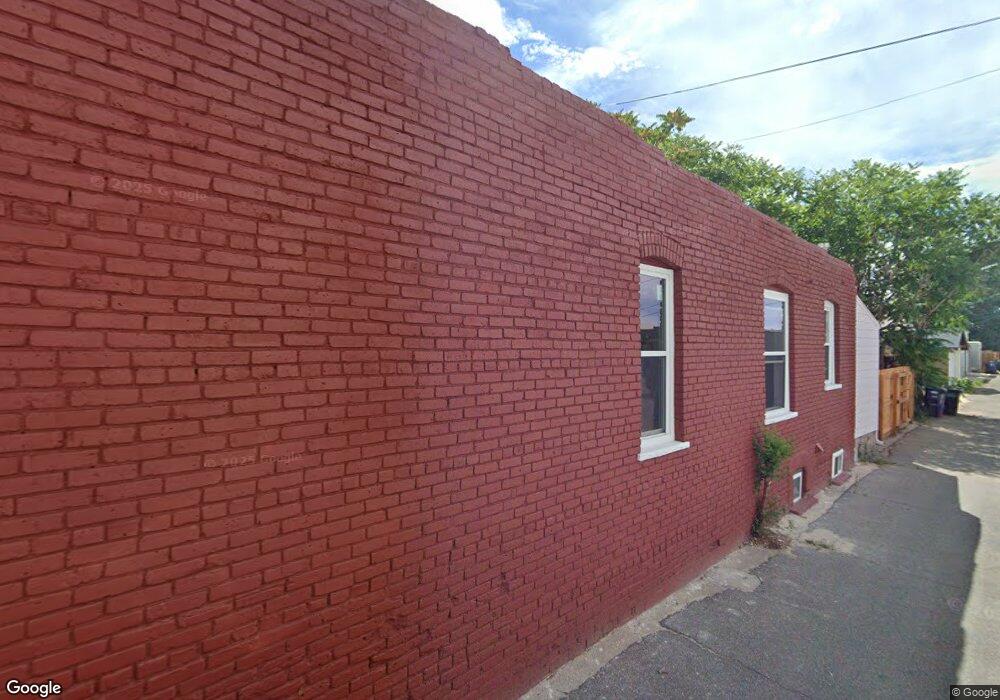
812 W 3rd Ave Denver, CO 80223
Baker NeighborhoodEstimated Value: $367,534 - $485,000
1
Bed
1
Bath
693
Sq Ft
$590/Sq Ft
Est. Value
About This Home
This home is located at 812 W 3rd Ave, Denver, CO 80223 and is currently estimated at $408,884, approximately $590 per square foot. 812 W 3rd Ave is a home with nearby schools including Kepner Beacon Middle School, West High School, and Girls Athletic Leadership School.
Ownership History
Date
Name
Owned For
Owner Type
Purchase Details
Closed on
Feb 3, 2010
Sold by
Martinez Randolph L and Martinez Debbie Guerra
Bought by
Martinez Dbbie Guerra
Current Estimated Value
Purchase Details
Closed on
Apr 21, 2003
Sold by
Coopersmith Jack
Bought by
Martinez Randolph L and Martinez Debbi G
Purchase Details
Closed on
Oct 25, 2001
Sold by
Coopersmith Jack
Bought by
Martinez Randolph L and Martinez Debbi G
Home Financials for this Owner
Home Financials are based on the most recent Mortgage that was taken out on this home.
Original Mortgage
$69,750
Interest Rate
6.71%
Purchase Details
Closed on
Oct 18, 2000
Sold by
Pierce Rock O and Maher Richard A
Bought by
Coopersmith Jack
Home Financials for this Owner
Home Financials are based on the most recent Mortgage that was taken out on this home.
Original Mortgage
$56,000
Interest Rate
7.89%
Create a Home Valuation Report for This Property
The Home Valuation Report is an in-depth analysis detailing your home's value as well as a comparison with similar homes in the area
Home Values in the Area
Average Home Value in this Area
Purchase History
| Date | Buyer | Sale Price | Title Company |
|---|---|---|---|
| Martinez Dbbie Guerra | -- | None Available | |
| Martinez Randolph L | -- | Security Title Guaranty Co | |
| Martinez Randolph L | $77,500 | -- | |
| Coopersmith Jack | $70,000 | -- |
Source: Public Records
Mortgage History
| Date | Status | Borrower | Loan Amount |
|---|---|---|---|
| Previous Owner | Martinez Randolph L | $69,750 | |
| Previous Owner | Coopersmith Jack | $56,000 |
Source: Public Records
Tax History Compared to Growth
Tax History
| Year | Tax Paid | Tax Assessment Tax Assessment Total Assessment is a certain percentage of the fair market value that is determined by local assessors to be the total taxable value of land and additions on the property. | Land | Improvement |
|---|---|---|---|---|
| 2024 | $1,939 | $24,480 | $1,660 | $22,820 |
| 2023 | $1,897 | $24,480 | $1,660 | $22,820 |
| 2022 | $1,811 | $22,770 | $5,550 | $17,220 |
| 2021 | $1,748 | $23,430 | $5,710 | $17,720 |
| 2020 | $1,823 | $24,570 | $4,560 | $20,010 |
| 2019 | $1,772 | $24,570 | $4,560 | $20,010 |
| 2018 | $1,424 | $18,410 | $3,070 | $15,340 |
| 2017 | $1,420 | $18,410 | $3,070 | $15,340 |
| 2016 | $1,329 | $16,300 | $3,391 | $12,909 |
| 2015 | $1,273 | $16,300 | $3,391 | $12,909 |
| 2014 | $1,087 | $13,090 | $812 | $12,278 |
Source: Public Records
Map
Nearby Homes
- 323 Inca St
- 351 Santa fe Dr
- 314 Galapago St
- 321 Fox St
- 475 Galapago St Unit 3
- 510 W 4th Ave
- 421 Elati St
- 333 Delaware St
- 469 Elati St
- 722 W 6th Ave
- 274 Delaware St
- 45 Galapago St
- 48 Galapago St
- 314 W 5th Ave
- 603 Inca St Unit 315
- 603 Inca St Unit 429
- 603 Inca St Unit 303
- 603 Inca St Unit 216
- 603 Inca St Unit 313
- 603 Inca St Unit 301