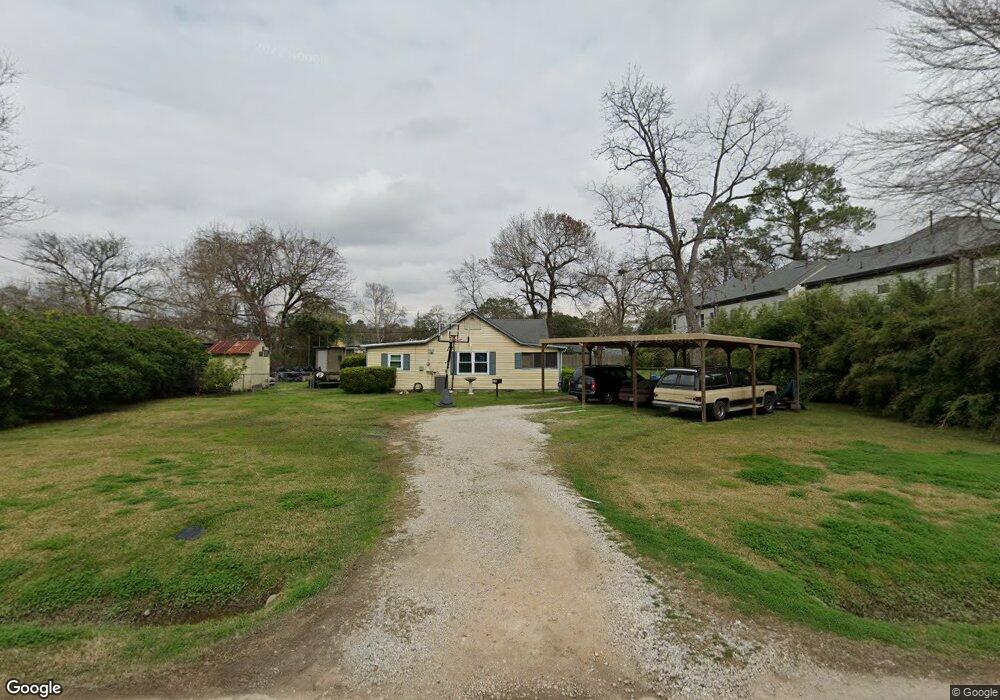
812 Woodcrest Dr Houston, TX 77018
Oak Forest-Garden Oaks NeighborhoodEstimated Value: $269,000 - $714,417
2
Beds
1
Bath
1,076
Sq Ft
$489/Sq Ft
Est. Value
About This Home
This home is located at 812 Woodcrest Dr, Houston, TX 77018 and is currently estimated at $526,604, approximately $489 per square foot. 812 Woodcrest Dr is a home located in Harris County with nearby schools including Durham Elementary School, Frank Black Middle School, and Waltrip High School.
Ownership History
Date
Name
Owned For
Owner Type
Purchase Details
Closed on
Jan 20, 2017
Sold by
Osterhaus Duane G
Bought by
Puckett Kacey L
Current Estimated Value
Home Financials for this Owner
Home Financials are based on the most recent Mortgage that was taken out on this home.
Original Mortgage
$110,095
Outstanding Balance
$90,754
Interest Rate
4.13%
Mortgage Type
New Conventional
Estimated Equity
$435,850
Purchase Details
Closed on
Apr 3, 1998
Sold by
Osterhaus Patricia A
Bought by
Osterhaus Duane G
Purchase Details
Closed on
Jan 26, 1995
Sold by
Mccauley Mary Lou and Greely Mary Lou
Bought by
Osterhaus Duane G and Osterhaus Patricia A
Home Financials for this Owner
Home Financials are based on the most recent Mortgage that was taken out on this home.
Original Mortgage
$23,000
Interest Rate
9.2%
Mortgage Type
Seller Take Back
Create a Home Valuation Report for This Property
The Home Valuation Report is an in-depth analysis detailing your home's value as well as a comparison with similar homes in the area
Home Values in the Area
Average Home Value in this Area
Purchase History
| Date | Buyer | Sale Price | Title Company |
|---|---|---|---|
| Puckett Kacey L | -- | None Available | |
| Osterhaus Duane G | -- | -- | |
| Osterhaus Duane G | -- | -- |
Source: Public Records
Mortgage History
| Date | Status | Borrower | Loan Amount |
|---|---|---|---|
| Open | Puckett Kacey L | $110,095 | |
| Previous Owner | Osterhaus Duane G | $23,000 |
Source: Public Records
Tax History Compared to Growth
Tax History
| Year | Tax Paid | Tax Assessment Tax Assessment Total Assessment is a certain percentage of the fair market value that is determined by local assessors to be the total taxable value of land and additions on the property. | Land | Improvement |
|---|---|---|---|---|
| 2025 | $2,503 | $828,275 | $792,960 | $35,315 |
| 2024 | $2,503 | $739,332 | $698,560 | $40,772 |
| 2023 | $2,503 | $637,652 | $604,160 | $33,492 |
| 2022 | $3,659 | $595,301 | $566,400 | $28,901 |
| 2021 | $3,521 | $551,319 | $528,640 | $22,679 |
| 2020 | $3,326 | $458,956 | $434,240 | $24,716 |
| 2019 | $3,159 | $356,586 | $320,960 | $35,626 |
| 2018 | $2,007 | $113,500 | $113,400 | $100 |
| 2017 | $2,870 | $113,500 | $113,280 | $220 |
| 2016 | $4,425 | $175,000 | $113,280 | $61,720 |
| 2015 | $3,522 | $177,779 | $113,280 | $64,499 |
| 2014 | $3,522 | $137,000 | $113,280 | $23,720 |
Source: Public Records
Map
Nearby Homes
- 808 Woodcrest Dr Unit A
- 810 Martin St
- 807 Martin St Unit D
- 807 Martin St Unit C
- 910 1/2 Oak St
- 812 Thornton Rd Unit B
- 4854 Brinkman St
- 817 Thornton Rd Unit G
- 817 Thornton Rd Unit F
- 811 Thornton Rd Unit B
- 9388 Plan at Thornton Oaks
- 9384 Plan at Thornton Oaks
- 717 Janisch Rd Unit C
- 717 Janisch Rd Unit I
- 717 Janisch Rd Unit E
- 717 Janisch Rd Unit D
- 719 Thornton Rd Unit B
- 719 Thornton Rd Unit E
- 719 Thornton Rd Unit A
- 719 Thornton Rd Unit F
- 816 Woodcrest Dr
- 808 Woodcrest Dr Unit B
- 808 Woodcrest Dr Unit C
- 808 Woodcrest Dr Unit D
- 827 Martin St
- 829 Martin St
- 831 Martin St
- 833 Martin St
- 825 Martin St
- 806 Woodcrest Dr
- 806 Woodcrest Dr Unit A
- 806 Woodcrest Dr Unit B
- 806 Woodcrest Dr Unit C
- 806 Woodcrest Dr Unit D
- 813 Martin St
- 818 Woodcrest Dr
- 835 Martin St
- 811 Martin St
- 815 Martin St
- 823 Martin St