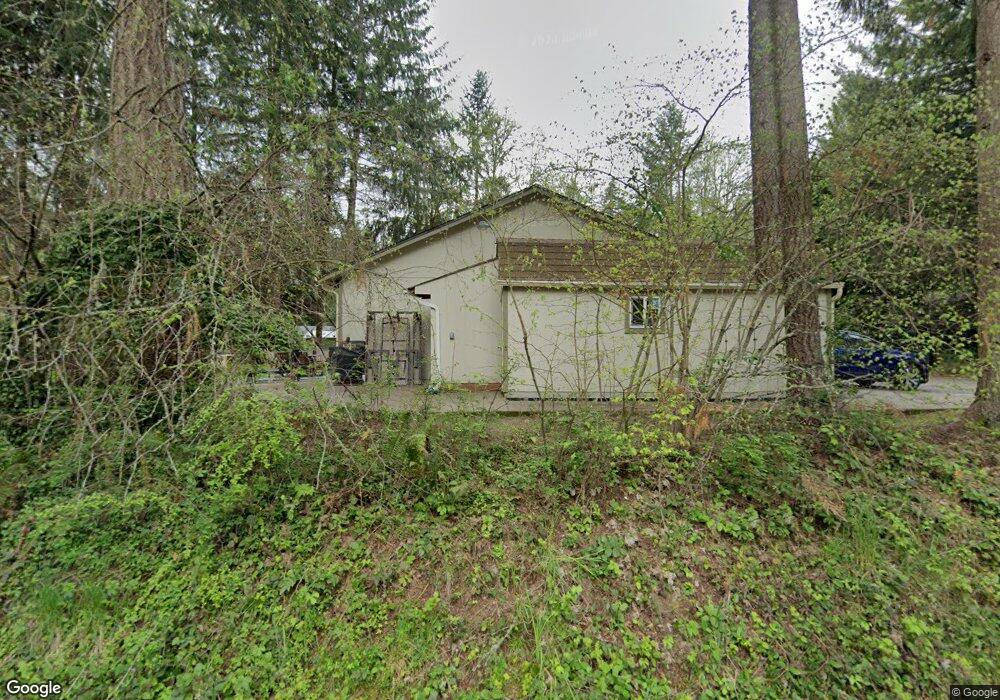
8121 58th Ave SE Olympia, WA 98513
The Lakes NeighborhoodEstimated Value: $444,000 - $498,000
3
Beds
3
Baths
1,376
Sq Ft
$338/Sq Ft
Est. Value
About This Home
This home is located at 8121 58th Ave SE, Olympia, WA 98513 and is currently estimated at $464,420, approximately $337 per square foot. 8121 58th Ave SE is a home located in Thurston County with nearby schools including Woodland Elementary School, Komachin Middle School, and Timberline High School.
Ownership History
Date
Name
Owned For
Owner Type
Purchase Details
Closed on
Dec 9, 2024
Sold by
Hooper Charles
Bought by
Hooper Charles and Hooper Jill
Current Estimated Value
Purchase Details
Closed on
Jul 23, 2003
Sold by
Mccuiston James T and Mccuiston Ragen M
Bought by
Hooper Charles B
Home Financials for this Owner
Home Financials are based on the most recent Mortgage that was taken out on this home.
Original Mortgage
$159,000
Interest Rate
5.15%
Mortgage Type
VA
Purchase Details
Closed on
Nov 21, 1997
Sold by
Richardson Edward D and Richardson Kari E
Bought by
Mccuiston James T and Mccuiston Ragen M
Purchase Details
Closed on
Jun 14, 1995
Sold by
Wellander Jeffrey R and Baumgardt Janice D
Bought by
Richardson Edward D and Richardson Kari E
Home Financials for this Owner
Home Financials are based on the most recent Mortgage that was taken out on this home.
Original Mortgage
$100,000
Interest Rate
8.37%
Mortgage Type
Construction
Create a Home Valuation Report for This Property
The Home Valuation Report is an in-depth analysis detailing your home's value as well as a comparison with similar homes in the area
Home Values in the Area
Average Home Value in this Area
Purchase History
| Date | Buyer | Sale Price | Title Company |
|---|---|---|---|
| Hooper Charles | -- | None Listed On Document | |
| Hooper Charles | -- | None Listed On Document | |
| Hooper Charles B | $159,000 | Stewart Title Of Wester | |
| Mccuiston James T | -- | First American Title Ins Co | |
| Richardson Edward D | $30,000 | Transamerica Title Ins Co |
Source: Public Records
Mortgage History
| Date | Status | Borrower | Loan Amount |
|---|---|---|---|
| Previous Owner | Hooper Charles B | $159,000 | |
| Previous Owner | Richardson Edward D | $100,000 |
Source: Public Records
Tax History Compared to Growth
Tax History
| Year | Tax Paid | Tax Assessment Tax Assessment Total Assessment is a certain percentage of the fair market value that is determined by local assessors to be the total taxable value of land and additions on the property. | Land | Improvement |
|---|---|---|---|---|
| 2024 | $3,560 | $391,100 | $163,600 | $227,500 |
| 2023 | $3,560 | $361,700 | $147,100 | $214,600 |
| 2022 | $3,544 | $379,200 | $104,700 | $274,500 |
| 2021 | $3,140 | $295,300 | $110,500 | $184,800 |
| 2020 | $2,892 | $243,100 | $102,600 | $140,500 |
| 2019 | $2,768 | $230,000 | $90,400 | $139,600 |
| 2018 | $3,048 | $217,300 | $74,300 | $143,000 |
| 2017 | $2,696 | $199,600 | $71,800 | $127,800 |
| 2016 | $2,812 | $197,150 | $70,050 | $127,100 |
| 2014 | -- | $205,200 | $67,300 | $137,900 |
Source: Public Records
Map
Nearby Homes
- 8004 Day Dr SE
- 7925 Mullen Rd SE
- 7638 Brianna Ct SE
- 7604 Brianna Ct SE
- 7519 Atchinson Dr SE
- 6701 Macintosh Ct SE
- 6725 Mirror Ct SE
- 7349 Fair Oaks Rd SE
- 5425 Atchinson Dr SE
- 8024 68th Loop SE
- 7645 Fair Oaks Loop SE
- 1176 68th Loop SE Unit 38
- 1173 68th Loop SE Unit 20
- 1180 68th Loop SE Unit 37
- 7506 50th Ave SE
- 7308 Fair Oaks Rd SE
- 7317 Fair Oaks Rd SE
- 7218 Spurgeon Creek Rd SE
- 4110 Arbor Dr SE
- 5920 Compton Loop SE
- 8120 59th Ct SE
- 8104 59th Ct SE
- 8115 58th Ave SE
- 8124 58th Ave SE
- 5733 Hollis Dr SE
- 8132 59th Ct SE
- 8111 58th Ave SE
- 8112 58th Ave SE
- 5715 Hollis Dr SE
- 8148 59th Ct SE
- 8108 59th Ct SE
- 5643 Hollis Dr Dr SE
- 5738 Hollis Dr SE
- 8107 58th Ave SE
- 5726 Hollis Dr SE
- 5726 Henslin Ct SE
- 8206 59th Ct SE
- 5714 Hollis Dr SE
- 5829 59th Ct SE