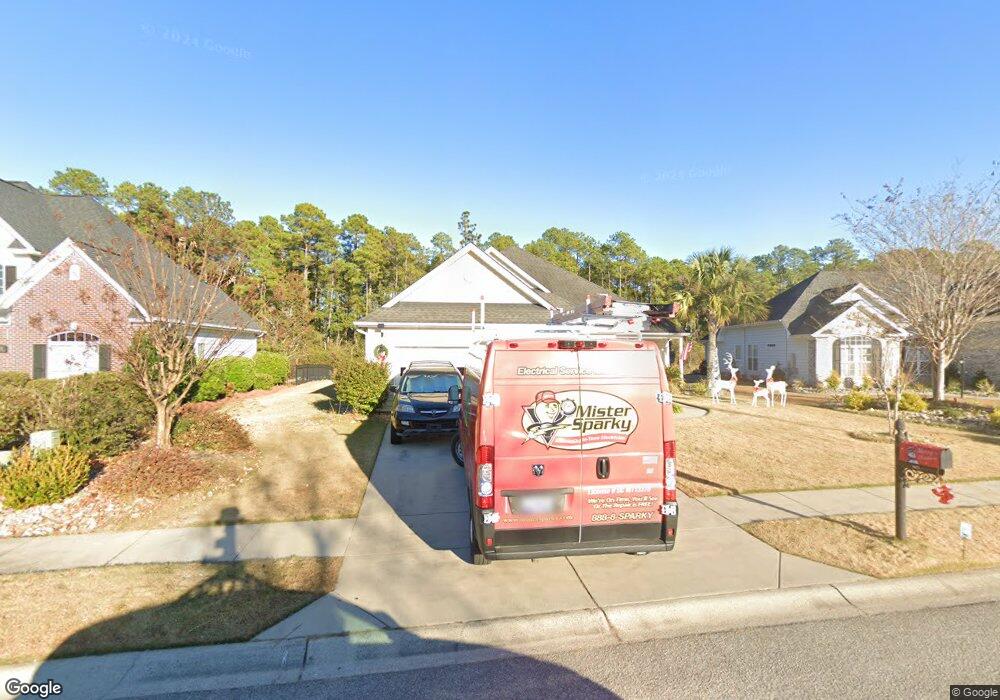
8121 Moonstruck Ct Unit Lot 373 Waterford P Myrtle Beach, SC 29579
Estimated Value: $455,762 - $493,000
3
Beds
2
Baths
2,467
Sq Ft
$192/Sq Ft
Est. Value
About This Home
This home is located at 8121 Moonstruck Ct Unit Lot 373 Waterford P, Myrtle Beach, SC 29579 and is currently estimated at $474,691, approximately $192 per square foot. 8121 Moonstruck Ct Unit Lot 373 Waterford P is a home located in Horry County with nearby schools including Carolina Forest Elementary School, Ten Oaks Middle, and Carolina Forest High School.
Ownership History
Date
Name
Owned For
Owner Type
Purchase Details
Closed on
Jul 29, 2022
Sold by
Generoso Vincent N
Bought by
Dean John F and Dean Omaira
Current Estimated Value
Home Financials for this Owner
Home Financials are based on the most recent Mortgage that was taken out on this home.
Original Mortgage
$283,327
Outstanding Balance
$271,279
Interest Rate
5.7%
Mortgage Type
New Conventional
Estimated Equity
$203,412
Purchase Details
Closed on
Aug 17, 2016
Sold by
Generoso Vincent N
Bought by
Generoso Paul M
Purchase Details
Closed on
Oct 4, 2012
Sold by
Rsp Builders
Bought by
Generoso Vincent N
Purchase Details
Closed on
Dec 21, 2011
Sold by
Heyward Barbara Neer
Bought by
Rsp Builders
Purchase Details
Closed on
Dec 29, 2005
Sold by
Waterford Partners Llc
Bought by
Heyward Barbara Neer
Create a Home Valuation Report for This Property
The Home Valuation Report is an in-depth analysis detailing your home's value as well as a comparison with similar homes in the area
Home Values in the Area
Average Home Value in this Area
Purchase History
| Date | Buyer | Sale Price | Title Company |
|---|---|---|---|
| Dean John F | $473,000 | -- | |
| Generoso Paul M | -- | -- | |
| Generoso Vincent N | $215,000 | -- | |
| Rsp Builders | $25,000 | -- | |
| Heyward Barbara Neer | $108,000 | None Available |
Source: Public Records
Mortgage History
| Date | Status | Borrower | Loan Amount |
|---|---|---|---|
| Open | Dean John F | $283,327 |
Source: Public Records
Tax History Compared to Growth
Tax History
| Year | Tax Paid | Tax Assessment Tax Assessment Total Assessment is a certain percentage of the fair market value that is determined by local assessors to be the total taxable value of land and additions on the property. | Land | Improvement |
|---|---|---|---|---|
| 2024 | $1,838 | $19,032 | $4,600 | $14,432 |
| 2023 | $1,838 | $9,624 | $2,408 | $7,216 |
| 2021 | $810 | $9,624 | $2,408 | $7,216 |
| 2020 | $707 | $9,624 | $2,408 | $7,216 |
| 2019 | $707 | $9,624 | $2,408 | $7,216 |
| 2018 | $0 | $9,790 | $1,602 | $8,188 |
| 2017 | $854 | $9,790 | $1,602 | $8,188 |
| 2016 | -- | $14,684 | $2,402 | $12,282 |
| 2015 | $854 | $9,790 | $1,602 | $8,188 |
| 2014 | $787 | $9,790 | $1,602 | $8,188 |
Source: Public Records
Map
Nearby Homes
- 8204 Caddis Ct
- 3112 Bayhaven Dr
- 8605 Hopper Ct
- 4190 Setter Ct
- 4635 Shaddowood Ct Unit MB
- 0 Gardner Lacy Rd
- 4826 Innisbrook Ct Unit 902
- 4826 Keel Ct
- 4818 Innisbrook Ct Unit 603
- 4818 Innisbrook Ct Unit 610
- 4814 Innisbrook Ct Unit 407
- 4818 Harvest Dr
- 4819 Innisbrook Ct Unit 510
- 4845 Meadowsweet Dr Unit 1407
- 4811 Innisbrook Ct Unit 306
- 3110 Bramble Glen Dr
- 5050 Glenbrook Dr Unit 201
- 5022 Belleglen Ct Unit 202
- 4846 Meadowsweet Dr Unit 11
- 4849 Meadowsweet Dr Unit 1606
- 8121 Moonstruck Ct
- 8121 Moonstruck Ct Unit Waterford Plantation
- 8121 Moonstruck Ct Unit Lot 373 Waterford Pl
- 8117 Moonstruck Ct Unit WATERFORD PLANTATION
- 8117 Moonstruck Ct Unit MB
- 8117 Moonstruck Ct Unit Lot 372
- 8125 Moonstruck Ct
- Lot 371 Moonstruck
- 8129 Moonstruck Ct Unit Waterford Plantation
- 8113 Moonstruck Ct Unit Waterford Plantation
- 8113 Moonstruck Ct Unit MB
- 8113 Moonstruck Ct Unit Lot 375
- 8113 Moonstruck Ct Unit Lot 376 Waterford Pl
- 8120 Moonstruck Ct
- 8120 Moonstruck Ct Unit Waterford Plantation
- 8114 Moonstruck Ct
- Lot 376 Moonstruck Ct Unit Waterford Plantation
- Lot 376 Moonstruck Ct
- Lot 376 Moonstruck Ct Unit Lot 376
- 8132 Moonstruck Ct