8121 Starling View Ct Las Vegas, NV 89166
Estimated Value: $405,904 - $429,000
3
Beds
3
Baths
1,840
Sq Ft
$227/Sq Ft
Est. Value
About This Home
This home is located at 8121 Starling View Ct, Las Vegas, NV 89166 and is currently estimated at $417,226, approximately $226 per square foot. 8121 Starling View Ct is a home located in Clark County with nearby schools including James Bilbray Elementary School, William & Mary Scherkenbach Elementary School, and Edmundo "Eddie" Escobedo, Sr. Middle School.
Ownership History
Date
Name
Owned For
Owner Type
Purchase Details
Closed on
May 10, 2021
Sold by
Garcia Nuez Isabel
Bought by
Garcia Nuez Isabel and Garcia Nuez Trust
Current Estimated Value
Purchase Details
Closed on
Jul 16, 2005
Sold by
Russo Mona
Bought by
Garcia Nuez Sergio and Garcia Nuez Isabel
Home Financials for this Owner
Home Financials are based on the most recent Mortgage that was taken out on this home.
Original Mortgage
$248,000
Outstanding Balance
$128,622
Interest Rate
5.56%
Mortgage Type
Fannie Mae Freddie Mac
Estimated Equity
$288,604
Purchase Details
Closed on
Feb 14, 2004
Sold by
Beazer Homes Holdings Corp
Bought by
Russo Mona
Home Financials for this Owner
Home Financials are based on the most recent Mortgage that was taken out on this home.
Original Mortgage
$185,900
Interest Rate
4.12%
Mortgage Type
Unknown
Create a Home Valuation Report for This Property
The Home Valuation Report is an in-depth analysis detailing your home's value as well as a comparison with similar homes in the area
Home Values in the Area
Average Home Value in this Area
Purchase History
| Date | Buyer | Sale Price | Title Company |
|---|---|---|---|
| Garcia Nuez Isabel | -- | None Available | |
| Garcia Nuez Sergio | $310,000 | Ticor Title Of Nevada Inc | |
| Russo Mona | $195,718 | First American Title Co Of |
Source: Public Records
Mortgage History
| Date | Status | Borrower | Loan Amount |
|---|---|---|---|
| Open | Garcia Nuez Sergio | $248,000 | |
| Previous Owner | Russo Mona | $185,900 |
Source: Public Records
Tax History Compared to Growth
Tax History
| Year | Tax Paid | Tax Assessment Tax Assessment Total Assessment is a certain percentage of the fair market value that is determined by local assessors to be the total taxable value of land and additions on the property. | Land | Improvement |
|---|---|---|---|---|
| 2025 | $1,692 | $106,876 | $30,450 | $76,426 |
| 2024 | $1,643 | $106,876 | $30,450 | $76,426 |
| 2023 | $1,643 | $104,209 | $32,200 | $72,009 |
| 2022 | $1,596 | $92,080 | $26,250 | $65,830 |
| 2021 | $1,620 | $85,868 | $23,450 | $62,418 |
| 2020 | $1,501 | $84,939 | $23,100 | $61,839 |
| 2019 | $1,407 | $80,723 | $19,950 | $60,773 |
| 2018 | $1,342 | $74,313 | $16,100 | $58,213 |
| 2017 | $2,172 | $66,245 | $14,350 | $51,895 |
| 2016 | $1,257 | $59,880 | $10,500 | $49,380 |
| 2015 | $1,254 | $46,378 | $8,750 | $37,628 |
| 2014 | $1,215 | $35,961 | $6,300 | $29,661 |
Source: Public Records
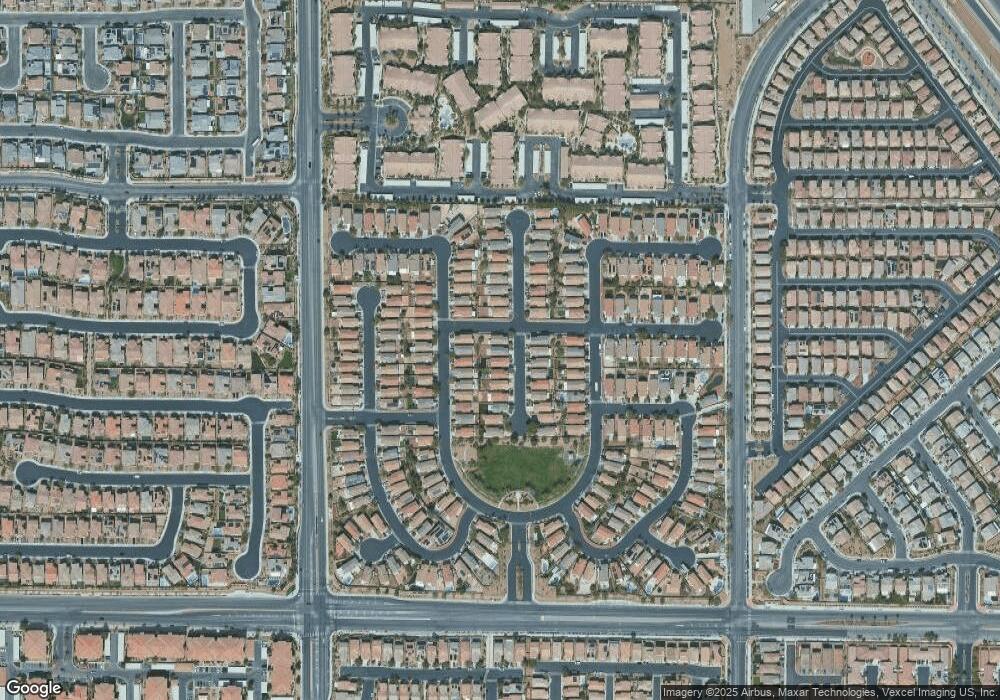
Map
Nearby Homes
- 8250 N Grand Canyon Dr Unit 1166
- 8250 N Grand Canyon Dr Unit 1159
- 8250 N Grand Canyon Dr Unit 2110
- 8250 N Grand Canyon Dr Unit 2154
- 8250 N Grand Canyon Dr Unit 2001
- 9553 Madsen Glen Ct
- 9408 Eagle River Ct
- 9612 Wildflower Vista Ave
- 9643 Wildflower Vista Ave
- 9333 Pearblossom Sky Ave
- 9685 Bold Skye Ave
- 9668 Canyon Landing Ave
- 9527 Havasu Canyon Ave
- 9454 Havasu Canyon Ave
- 8305 Vanhoy Creek St
- 9330 Brookmont Ave
- 8321 Vanhoy Creek St
- 8352 Vanhoy Creek St
- 9461 Sweetwood Ave
- 8337 Vanhoy Creek St
- 8117 Starling View Ct
- 8125 Starling View Ct
- 8113 Starling View Ct
- 8120 Tilkuni Dr
- 8116 Tilkuni Dr
- 8109 Starling View Ct
- 8124 Tilkuni Dr
- 8133 Starling View Ct
- 8112 Tilkuni Dr
- 8105 Starling View Ct
- 8124 Starling View Ct Unit 3
- 8116 Starling View Ct
- 8108 Tilkuni Dr
- 8112 Starling View Ct
- 8137 Starling View Ct
- 8104 Tilkuni Dr
- 8108 Starling View Ct Unit 3
- 8101 Starling View Ct
- 8101 Starling View Ct Unit n/a
- 8132 Starling View Ct Unit 3