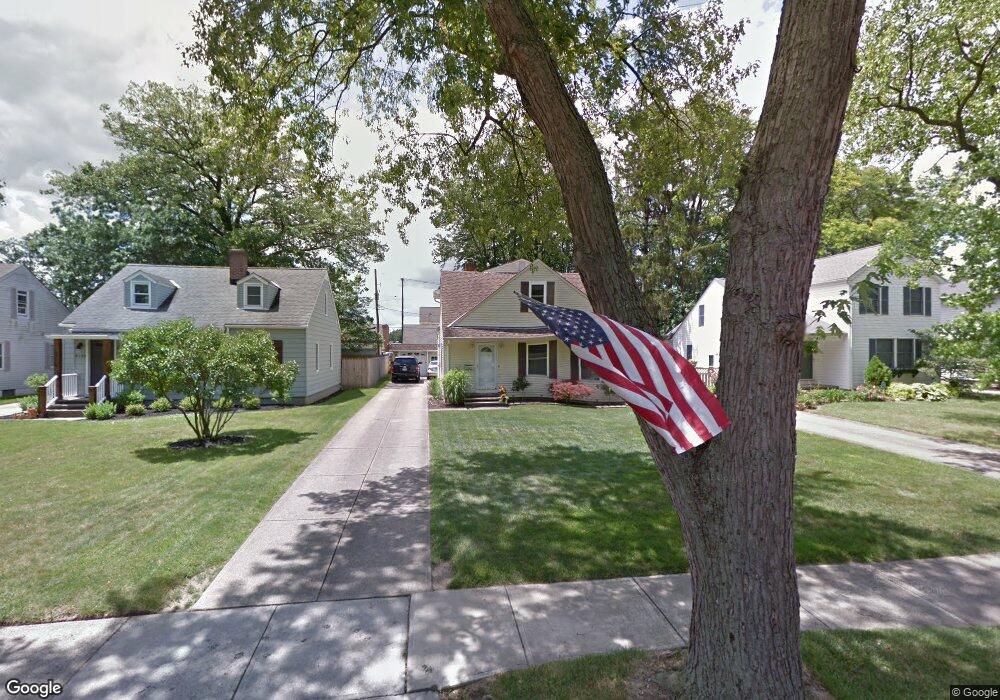
8122 Lynway Ave Olmsted Falls, OH 44138
Estimated Value: $245,561 - $297,000
3
Beds
2
Baths
1,612
Sq Ft
$171/Sq Ft
Est. Value
About This Home
This home is located at 8122 Lynway Ave, Olmsted Falls, OH 44138 and is currently estimated at $275,890, approximately $171 per square foot. 8122 Lynway Ave is a home located in Cuyahoga County with nearby schools including Falls-Lenox Primary Elementary School, Olmsted Falls Intermediate Building, and Olmsted Falls Middle School.
Ownership History
Date
Name
Owned For
Owner Type
Purchase Details
Closed on
Mar 19, 2008
Sold by
American General Financial Services Inc
Bought by
Krall Bryan J
Current Estimated Value
Home Financials for this Owner
Home Financials are based on the most recent Mortgage that was taken out on this home.
Original Mortgage
$95,500
Outstanding Balance
$59,495
Interest Rate
5.74%
Mortgage Type
Purchase Money Mortgage
Estimated Equity
$216,395
Purchase Details
Closed on
Sep 12, 2007
Sold by
Butcher Danny J and Butcher Kim
Bought by
American General Financial Services Inc
Purchase Details
Closed on
Mar 15, 1991
Bought by
Butcher Danny J
Purchase Details
Closed on
Mar 19, 1984
Sold by
Mischnick Walter E and Mischnick Carol J
Bought by
Mischnick Walter Ernest
Purchase Details
Closed on
Jan 1, 1975
Bought by
Mischnick Walter E and Mischnick Carol J
Create a Home Valuation Report for This Property
The Home Valuation Report is an in-depth analysis detailing your home's value as well as a comparison with similar homes in the area
Home Values in the Area
Average Home Value in this Area
Purchase History
| Date | Buyer | Sale Price | Title Company |
|---|---|---|---|
| Krall Bryan J | $105,000 | Patriot Land Title Ii | |
| American General Financial Services Inc | $100,000 | Attorney | |
| Butcher Danny J | $87,000 | -- | |
| Prudential Residential Serv. | $87,000 | -- | |
| Mischnick Walter Ernest | -- | -- | |
| Mischnick Walter E | -- | -- |
Source: Public Records
Mortgage History
| Date | Status | Borrower | Loan Amount |
|---|---|---|---|
| Open | Krall Bryan J | $95,500 |
Source: Public Records
Tax History Compared to Growth
Tax History
| Year | Tax Paid | Tax Assessment Tax Assessment Total Assessment is a certain percentage of the fair market value that is determined by local assessors to be the total taxable value of land and additions on the property. | Land | Improvement |
|---|---|---|---|---|
| 2024 | $5,605 | $84,140 | $12,635 | $71,505 |
| 2023 | $4,646 | $56,740 | $11,730 | $45,010 |
| 2022 | $4,604 | $56,740 | $11,730 | $45,010 |
| 2021 | $4,561 | $56,740 | $11,730 | $45,010 |
| 2020 | $4,127 | $45,400 | $9,380 | $36,020 |
| 2019 | $3,675 | $129,700 | $26,800 | $102,900 |
| 2018 | $3,670 | $45,400 | $9,380 | $36,020 |
| 2017 | $3,712 | $42,460 | $10,050 | $32,410 |
| 2016 | $3,693 | $42,460 | $10,050 | $32,410 |
| 2015 | $3,518 | $42,460 | $10,050 | $32,410 |
| 2014 | $3,518 | $39,310 | $9,310 | $30,000 |
Source: Public Records
Map
Nearby Homes
- 26535 Bayfair Dr
- V/L Columbia Rd
- 0
- 7593 Columbia Rd
- 25725 Cook Rd
- 26685 Cranage Rd
- 281-12-024 River Rd
- 281-12-007 River Rd
- 8241 Lewis Rd
- 29 Carl Ln
- 26788 Skyline Dr
- Anderson Plan at Smokestack Trails
- Bramante Ranch Plan at Smokestack Trails
- Hudson Plan at Smokestack Trails
- Columbia Plan at Smokestack Trails
- Lehigh Plan at Smokestack Trails
- 27 Sycamore Dr
- 11 Concert Ct
- 52 Periwinkle Dr
- 42 Periwinkle Dr
- 8112 Lynway Ave
- 8132 Lynway Ave
- 8100 Lynway Ave
- 8144 Lynway Ave
- 8088 Lynway Ave
- 8117 Mapleway Dr
- 8133 Mapleway Dr
- 8105 Mapleway Dr
- 8145 Mapleway Dr
- 8089 Mapleway Dr
- 8125 Lynway Ave
- 8113 Lynway Ave
- 8168 Lynway Ave
- 8137 Lynway Ave
- 8073 Mapleway Dr
- 8157 Mapleway Dr
- 8101 Lynway Ave
- 8149 Lynway Ave
- 8091 Lynway Ave
- 26027 Garfield Ave