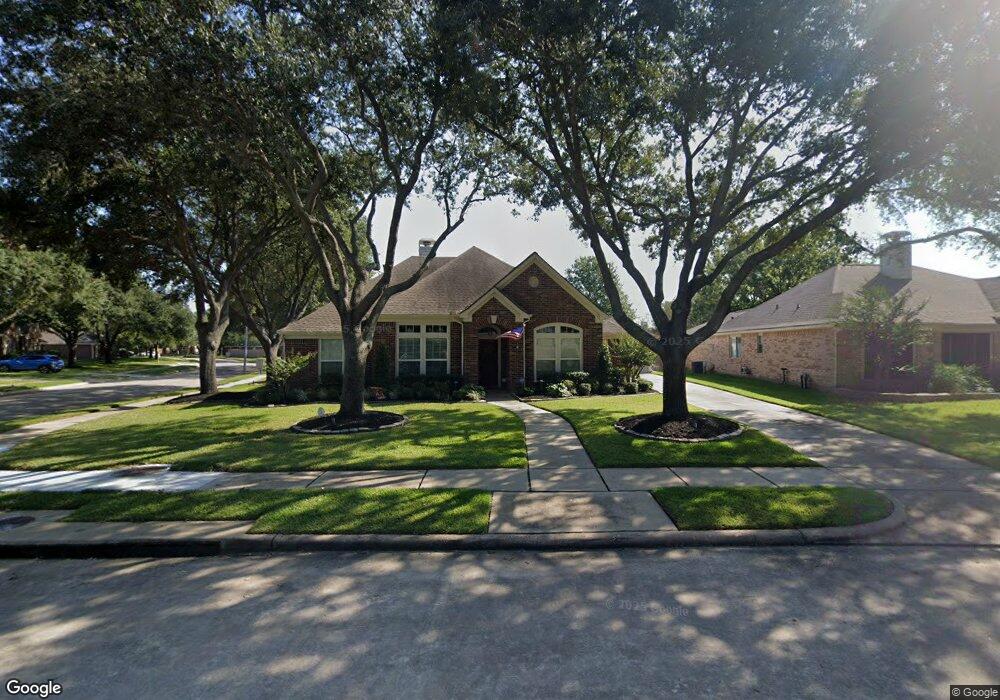
8122 Millrun Dr Houston, TX 77095
Copperfield NeighborhoodEstimated Value: $355,000 - $377,000
4
Beds
2
Baths
2,427
Sq Ft
$151/Sq Ft
Est. Value
About This Home
This home is located at 8122 Millrun Dr, Houston, TX 77095 and is currently estimated at $367,055, approximately $151 per square foot. 8122 Millrun Dr is a home located in Harris County with nearby schools including Birkes Elementary School, Aragon Middle School, and Langham Creek High School.
Ownership History
Date
Name
Owned For
Owner Type
Purchase Details
Closed on
Apr 7, 2017
Sold by
Frasier Mike R
Bought by
Wilkens David and Wilkens Darlene
Current Estimated Value
Home Financials for this Owner
Home Financials are based on the most recent Mortgage that was taken out on this home.
Original Mortgage
$189,600
Outstanding Balance
$157,298
Interest Rate
4.1%
Mortgage Type
New Conventional
Estimated Equity
$209,757
Purchase Details
Closed on
May 31, 2001
Sold by
Frasier Diane Lyn
Bought by
Frasier Mike R
Purchase Details
Closed on
Jul 14, 1997
Sold by
Perry Homes
Bought by
Frasier Michael R and Frasier Diane L
Home Financials for this Owner
Home Financials are based on the most recent Mortgage that was taken out on this home.
Original Mortgage
$102,800
Interest Rate
7.72%
Create a Home Valuation Report for This Property
The Home Valuation Report is an in-depth analysis detailing your home's value as well as a comparison with similar homes in the area
Home Values in the Area
Average Home Value in this Area
Purchase History
| Date | Buyer | Sale Price | Title Company |
|---|---|---|---|
| Wilkens David | -- | Frontier Title Co | |
| Frasier Mike R | -- | -- | |
| Frasier Michael R | -- | Chicago Title Insurance Co |
Source: Public Records
Mortgage History
| Date | Status | Borrower | Loan Amount |
|---|---|---|---|
| Open | Wilkens David | $189,600 | |
| Previous Owner | Frasier Michael R | $102,800 |
Source: Public Records
Tax History Compared to Growth
Tax History
| Year | Tax Paid | Tax Assessment Tax Assessment Total Assessment is a certain percentage of the fair market value that is determined by local assessors to be the total taxable value of land and additions on the property. | Land | Improvement |
|---|---|---|---|---|
| 2025 | $2,479 | $341,394 | $72,252 | $269,142 |
| 2024 | $2,479 | $352,809 | $72,252 | $280,557 |
| 2023 | $2,479 | $349,179 | $72,252 | $276,927 |
| 2022 | $7,330 | $323,827 | $51,557 | $272,270 |
| 2021 | $7,059 | $252,037 | $51,557 | $200,480 |
| 2020 | $6,695 | $232,134 | $42,843 | $189,291 |
| 2019 | $6,733 | $227,028 | $36,308 | $190,720 |
| 2018 | $1,904 | $227,775 | $36,308 | $191,467 |
| 2017 | $6,779 | $227,775 | $36,308 | $191,467 |
| 2016 | $6,759 | $227,775 | $36,308 | $191,467 |
| 2015 | $4,839 | $214,513 | $36,308 | $178,205 |
| 2014 | $4,839 | $187,693 | $29,046 | $158,647 |
Source: Public Records
Map
Nearby Homes
- 16335 Drystone Ln
- 16510 Wellers Way
- 16426 Torry View Terrace
- 16403 Torry View Terrace
- 16511 Crystal View Ct
- 8550 Waiting Spring Ln
- 8619 Arranmore Ln
- 16315 Battlecreek Dr
- 8426 Laurel Trails Dr
- 16611 Gentle Stone Dr
- 16215 Wemyss Bay Rd
- 16606 Stoneside Dr
- 16514 Innisbrook Dr
- 16215 Cairngorm Ave
- 16319 Chimneystone Dr
- 16410 Dawnblush Ct
- 16535 Oat Mill Dr
- 16114 Kintyre Point Rd
- 8550 Sparkling Springs Dr
- 7622 Mccormick Mill Ct
- 8118 Millrun Dr
- 16423 Shining Rock Ln
- 16419 Shining Rock Ln
- 8303 W Copper Village Dr
- 8230 W Copper Village Dr
- 8307 W Copper Village Dr
- 16415 Shining Rock Ln
- 8226 W Copper Village Dr
- 16411 Shining Rock Ln
- 16407 Drystone Ln
- 16403 Drystone Ln
- 16422 Shining Rock Ln
- 8223 W Copper Village Dr
- 8315 E Copper Village Dr
- 16418 Shining Rock Ln
- 16411 Drystone Ln
- 8222 W Copper Village Dr
- 16410 Shining Rock Ln
- 8219 W Copper Village Dr
- 16415 Drystone Ln