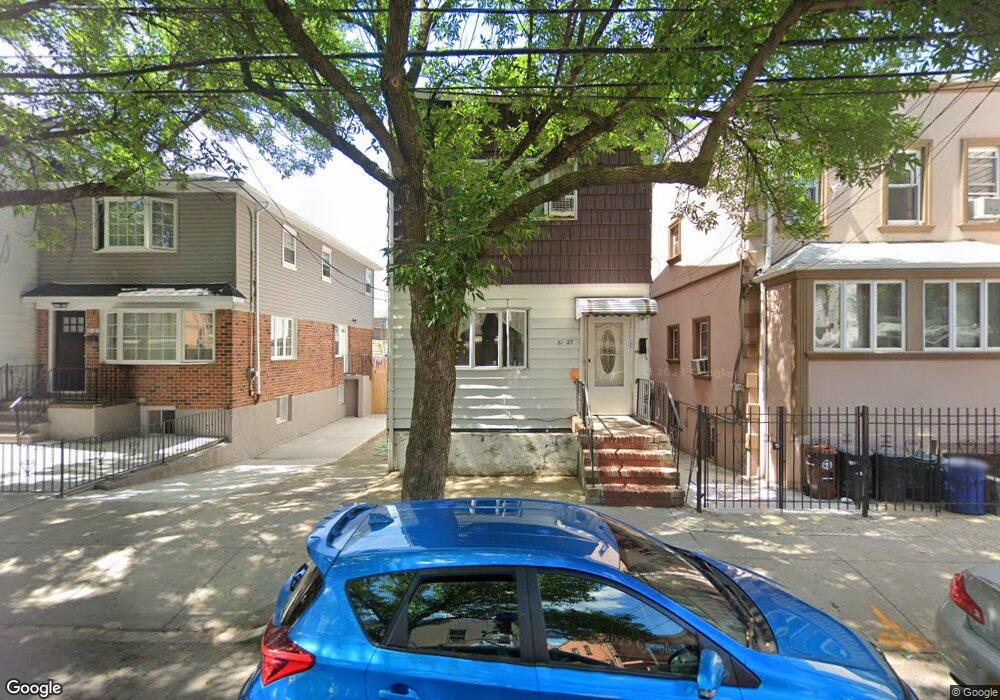
8125 102nd Ave Ozone Park, NY 11416
Ozone Park NeighborhoodEstimated Value: $696,000 - $772,000
--
Bed
--
Bath
1,256
Sq Ft
$580/Sq Ft
Est. Value
About This Home
This home is located at 8125 102nd Ave, Ozone Park, NY 11416 and is currently estimated at $727,905, approximately $579 per square foot. 8125 102nd Ave is a home located in Queens County with nearby schools including P.S. 63 - Old South, Santiam Elementary School, and Jhs 210 Elizabeth Blackwell.
Ownership History
Date
Name
Owned For
Owner Type
Purchase Details
Closed on
Nov 27, 2019
Sold by
Aime Wilfrid and Aime Yolanda
Bought by
Khaleque Mohammed Abdul and Nessa Mst Shiritun
Current Estimated Value
Purchase Details
Closed on
Sep 23, 1997
Sold by
Goldcoast Management Inc
Bought by
Aime Wilfrid and Aime Yolanda
Home Financials for this Owner
Home Financials are based on the most recent Mortgage that was taken out on this home.
Original Mortgage
$149,000
Interest Rate
7.19%
Purchase Details
Closed on
Apr 30, 1997
Sold by
Carbone Charles and Valkonis Spiros
Bought by
Gold Coast Management Inc
Home Financials for this Owner
Home Financials are based on the most recent Mortgage that was taken out on this home.
Original Mortgage
$80,000
Interest Rate
7.81%
Create a Home Valuation Report for This Property
The Home Valuation Report is an in-depth analysis detailing your home's value as well as a comparison with similar homes in the area
Home Values in the Area
Average Home Value in this Area
Purchase History
| Date | Buyer | Sale Price | Title Company |
|---|---|---|---|
| Khaleque Mohammed Abdul | $470,000 | -- | |
| Aime Wilfrid | $159,000 | Washington Title Insurance C | |
| Gold Coast Management Inc | $105,000 | Commonwealth Land Title Ins |
Source: Public Records
Mortgage History
| Date | Status | Borrower | Loan Amount |
|---|---|---|---|
| Previous Owner | Aime Wilfrid | $149,000 | |
| Previous Owner | Gold Coast Management Inc | $80,000 |
Source: Public Records
Tax History Compared to Growth
Tax History
| Year | Tax Paid | Tax Assessment Tax Assessment Total Assessment is a certain percentage of the fair market value that is determined by local assessors to be the total taxable value of land and additions on the property. | Land | Improvement |
|---|---|---|---|---|
| 2025 | $5,699 | $30,025 | $8,087 | $21,938 |
| 2024 | $5,699 | $28,373 | $7,447 | $20,926 |
| 2023 | $5,501 | $27,086 | $7,588 | $19,498 |
| 2022 | $5,149 | $41,400 | $12,960 | $28,440 |
| 2021 | $5,429 | $38,460 | $12,960 | $25,500 |
| 2020 | $5,296 | $36,600 | $12,960 | $23,640 |
| 2019 | $4,653 | $37,200 | $12,960 | $24,240 |
| 2018 | $4,304 | $22,572 | $8,897 | $13,675 |
| 2017 | $4,082 | $21,496 | $9,754 | $11,742 |
| 2016 | $3,987 | $21,496 | $9,754 | $11,742 |
| 2015 | $2,226 | $20,851 | $10,739 | $10,112 |
| 2014 | $2,226 | $19,704 | $11,023 | $8,681 |
Source: Public Records
Map
Nearby Homes
- 81-25 102nd Ave
- 8129 102nd Ave
- 8123 102nd Ave
- 81-31 102nd Ave
- 8121 102nd Ave
- 8131 102nd Ave
- 8119 102nd Ave
- 8119 102nd Ave
- 8133 102nd Ave
- 8133 102nd Ave
- 82-06 101st Ave Unit 1st Fl
- 8118 101st Ave
- 8117 102nd Ave
- 8137 102nd Ave
- 8202 101st Ave
- 8122 101st Ave
- 8204 101st Ave
- 81-37 102nd Ave
- 8206 101st Ave
- 81-39 102nd Ave