Estimated Value: $946,000 - $1,083,405
4
Beds
4
Baths
5,400
Sq Ft
$191/Sq Ft
Est. Value
About This Home
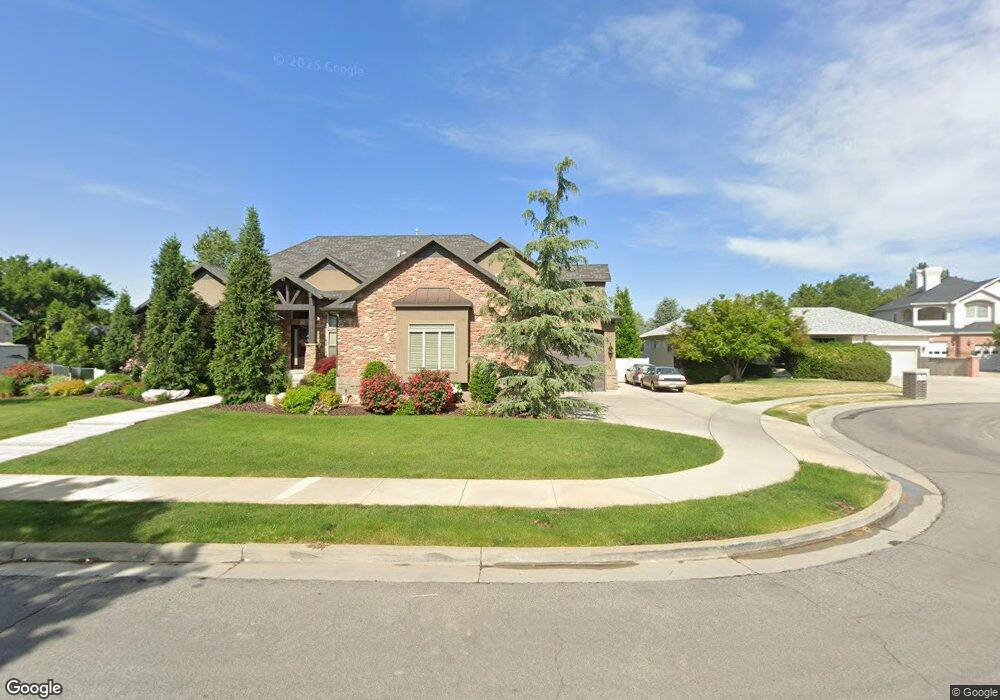
This home is located at 8126 Hidden Springs Cove, Sandy, UT 84094 and is currently estimated at $1,029,101, approximately $190 per square foot. 8126 Hidden Springs Cove is a home located in Salt Lake County with nearby schools including East Sandy School, Union Middle School, and Hillcrest High School.
Ownership History
Date
Name
Owned For
Owner Type
Purchase Details
Closed on
Oct 5, 2021
Sold by
Tang Hoi F and Chen Macy
Bought by
Tang Hoi F and Chen Macy
Current Estimated Value
Purchase Details
Closed on
Jun 4, 2018
Sold by
Mcdonough David and Mcdonough Jennifer
Bought by
Mcdonough Jennifer T and Jennifer T Mcdonough Trust
Purchase Details
Closed on
Jan 3, 2012
Sold by
Phengphong Sonesinxay
Bought by
Phengphong Sonesinxay and Chen Li Chang
Home Financials for this Owner
Home Financials are based on the most recent Mortgage that was taken out on this home.
Original Mortgage
$260,000
Interest Rate
3.91%
Mortgage Type
New Conventional
Purchase Details
Closed on
Sep 7, 2011
Sold by
Winward Douglas A
Bought by
Gary Anderson Construction
Purchase Details
Closed on
May 24, 2007
Sold by
Winward Douglas
Bought by
Winward Douglas A
Home Financials for this Owner
Home Financials are based on the most recent Mortgage that was taken out on this home.
Original Mortgage
$150,000
Interest Rate
5.85%
Mortgage Type
Stand Alone Second
Purchase Details
Closed on
Jun 2, 2006
Sold by
Winward Brandy Rachelle
Bought by
Winward Douglas
Home Financials for this Owner
Home Financials are based on the most recent Mortgage that was taken out on this home.
Original Mortgage
$104,000
Interest Rate
6.52%
Mortgage Type
Stand Alone Second
Purchase Details
Closed on
May 31, 2005
Sold by
Winward Brandy
Bought by
Winward Brandy Rachele
Home Financials for this Owner
Home Financials are based on the most recent Mortgage that was taken out on this home.
Original Mortgage
$359,650
Interest Rate
5%
Mortgage Type
New Conventional
Purchase Details
Closed on
May 27, 2005
Sold by
Larsen Gregory A
Bought by
Winward Brandy
Home Financials for this Owner
Home Financials are based on the most recent Mortgage that was taken out on this home.
Original Mortgage
$359,650
Interest Rate
5%
Mortgage Type
New Conventional
Purchase Details
Closed on
Aug 11, 1998
Sold by
Larsen Brenda L
Bought by
Larsen Gregory A
Purchase Details
Closed on
May 1, 1995
Sold by
Larsen Brenda L
Bought by
Larsen Brenda L and Larsen Gregory A
Home Financials for this Owner
Home Financials are based on the most recent Mortgage that was taken out on this home.
Original Mortgage
$228,000
Interest Rate
8.46%
Create a Home Valuation Report for This Property
The Home Valuation Report is an in-depth analysis detailing your home's value as well as a comparison with similar homes in the area
Home Values in the Area
Average Home Value in this Area
Purchase History
| Date | Buyer | Sale Price | Title Company |
|---|---|---|---|
| Tang Hoi F | -- | None Available | |
| Hoi F Tang Revocable Trust | -- | None Listed On Document | |
| Mcdonough Jennifer T | -- | None Available | |
| Phengphong Sonesinxay | -- | Surety Title | |
| Phengphong Sonesinxay | -- | Premier Title Ins Agency | |
| Gary Anderson Construction | -- | Premier Title Ins Agency | |
| Winward Douglas A | -- | Merrill Title | |
| Winward Douglas | -- | Paramount Title | |
| Winward Brandy Rachele | -- | Security Title Ins Agency | |
| Winward Brandy | -- | Integrated Title Ins Service | |
| Larsen Gregory A | -- | -- | |
| Larsen Brenda L | -- | -- |
Source: Public Records
Mortgage History
| Date | Status | Borrower | Loan Amount |
|---|---|---|---|
| Previous Owner | Phengphong Sonesinxay | $260,000 | |
| Previous Owner | Winward Douglas A | $150,000 | |
| Previous Owner | Winward Douglas | $104,000 | |
| Previous Owner | Winward Douglas | $416,000 | |
| Previous Owner | Winward Brandy Rachele | $359,650 | |
| Previous Owner | Winward Brandy | $90,350 | |
| Previous Owner | Larsen Brenda L | $228,000 | |
| Closed | Winward Brandy Rachele | $90,350 |
Source: Public Records
Tax History Compared to Growth
Tax History
| Year | Tax Paid | Tax Assessment Tax Assessment Total Assessment is a certain percentage of the fair market value that is determined by local assessors to be the total taxable value of land and additions on the property. | Land | Improvement |
|---|---|---|---|---|
| 2025 | $5,073 | $968,800 | $243,700 | $725,100 |
| 2024 | $5,073 | $937,100 | $234,600 | $702,500 |
| 2023 | $5,073 | $829,200 | $225,500 | $603,700 |
| 2022 | $4,692 | $845,300 | $221,100 | $624,200 |
| 2021 | $4,242 | $649,200 | $193,000 | $456,200 |
| 2020 | $4,315 | $623,100 | $167,900 | $455,200 |
| 2019 | $4,391 | $617,700 | $158,400 | $459,300 |
| 2018 | $4,184 | $613,700 | $158,400 | $455,300 |
| 2017 | $3,923 | $549,200 | $158,400 | $390,800 |
| 2016 | $3,929 | $517,300 | $142,700 | $374,600 |
| 2015 | $4,297 | $524,800 | $182,200 | $342,600 |
| 2014 | $4,069 | $488,300 | $173,800 | $314,500 |
Source: Public Records
Map
Nearby Homes
- 8017 S Showcase Ln
- 8149 S Cottonwood Hills Cir Unit 158149
- 1077 E 8320 S Unit 18
- 1169 E Cottonwood Hills Dr Unit 56
- 8335 S 1050 E
- 1263 E Cottonwood Hills Dr
- 1235 E Cottonwood Hills Dr
- 7926 S 965 E
- 7964 S 860 E
- 842 E 8270 S
- 909 E 7865 S
- 1327 Madrid Way
- 795 E 8125 S
- 1316 Pinewood Dr
- 7734 S 1100 E
- 760 E 8080 S
- 772 E 8270 S
- 954 E 7725 S
- 7825 S Spruce Tree Ln
- 8284 S 745 E
- 8122 S Hidden Springs Cove
- 8122 Hidden Springs Cove
- 8132 Hidden Springs Cove
- 8126 S Hidden Springs Cove
- 1092 Old Dairy Rd
- 8133 Smart Ln
- 8125 S 1060 E
- 1102 Old Dairy Rd
- 8121 Hidden Springs Cove
- 8130 S Smart Ln
- 8130 S Smart Ln
- 8139 S 1060 E
- 8139 Smart Ln
- 8127 Hidden Springs Cove
- 8127 S Smart Ln
- 8142 Hidden Springs Cove
- 8135 Hidden Springs Cove
- 8135 S Hidden Springs Cove
- 8152 Hidden Springs Cove
- 8126 Smart Ln