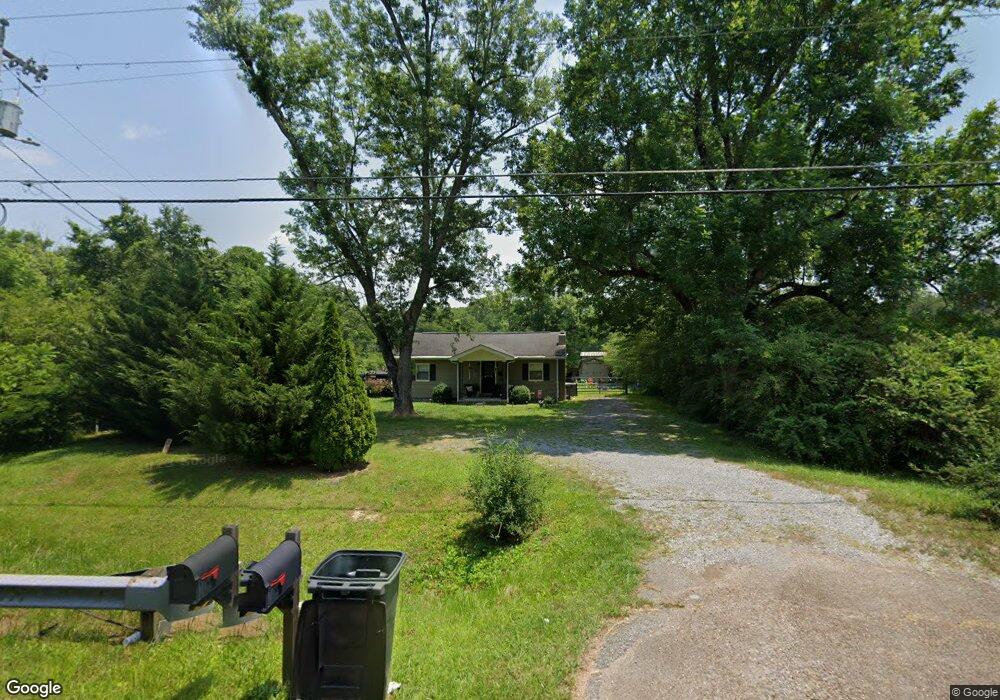
8127 Highway 193 Flintstone, GA 30725
High Point NeighborhoodEstimated Value: $262,448 - $292,000
--
Bed
2
Baths
1,455
Sq Ft
$191/Sq Ft
Est. Value
About This Home
This home is located at 8127 Highway 193, Flintstone, GA 30725 and is currently estimated at $278,612, approximately $191 per square foot. 8127 Highway 193 is a home located in Walker County with nearby schools including Chattanooga Valley Elementary School, Chattanooga Valley Middle School, and Ridgeland High School.
Ownership History
Date
Name
Owned For
Owner Type
Purchase Details
Closed on
Jun 24, 2022
Sold by
Bowen Johnny Michael
Bought by
Bowen Jordan and Bowen Michael
Current Estimated Value
Home Financials for this Owner
Home Financials are based on the most recent Mortgage that was taken out on this home.
Original Mortgage
$188,237
Outstanding Balance
$179,831
Interest Rate
5.75%
Mortgage Type
FHA
Estimated Equity
$98,781
Purchase Details
Closed on
Mar 30, 1988
Sold by
Wf Harwood W and Wf Ezell
Bought by
Bowen Johnny M and Bowen Cynthia
Purchase Details
Closed on
Dec 22, 1987
Sold by
Derryberry John Willard
Bought by
Wf Harwood W and Wf Ezell
Purchase Details
Closed on
Sep 8, 1981
Sold by
Paris Wilburn H and Wf Lucille
Bought by
Derryberry John Willard
Purchase Details
Closed on
Feb 3, 1981
Sold by
Goza Gail
Bought by
Paris Wilburn H and Wf Lucille
Purchase Details
Closed on
Nov 1, 1977
Sold by
Paris Wilburn H
Bought by
Goza Gail
Purchase Details
Closed on
Jun 15, 1965
Bought by
Paris Wilburn H
Create a Home Valuation Report for This Property
The Home Valuation Report is an in-depth analysis detailing your home's value as well as a comparison with similar homes in the area
Home Values in the Area
Average Home Value in this Area
Purchase History
| Date | Buyer | Sale Price | Title Company |
|---|---|---|---|
| Bowen Jordan | $235,000 | -- | |
| Bowen Johnny M | $25,000 | -- | |
| Wf Harwood W | $10,000 | -- | |
| Derryberry John Willard | $25,000 | -- | |
| Paris Wilburn H | -- | -- | |
| Goza Gail | -- | -- | |
| Paris Wilburn H | -- | -- |
Source: Public Records
Mortgage History
| Date | Status | Borrower | Loan Amount |
|---|---|---|---|
| Open | Bowen Jordan | $188,237 |
Source: Public Records
Tax History Compared to Growth
Tax History
| Year | Tax Paid | Tax Assessment Tax Assessment Total Assessment is a certain percentage of the fair market value that is determined by local assessors to be the total taxable value of land and additions on the property. | Land | Improvement |
|---|---|---|---|---|
| 2024 | $1,406 | $59,161 | $7,434 | $51,727 |
| 2023 | $1,356 | $55,605 | $6,638 | $48,967 |
| 2022 | $851 | $38,583 | $1,908 | $36,675 |
| 2021 | $812 | $27,890 | $1,908 | $25,982 |
| 2020 | $702 | $22,848 | $1,908 | $20,940 |
| 2019 | $713 | $22,848 | $1,908 | $20,940 |
| 2018 | $605 | $22,848 | $1,908 | $20,940 |
| 2017 | $777 | $22,848 | $1,908 | $20,940 |
| 2016 | $640 | $22,848 | $1,908 | $20,940 |
| 2015 | $768 | $26,493 | $3,224 | $23,269 |
| 2014 | $683 | $26,493 | $3,224 | $23,269 |
| 2013 | -- | $26,493 | $3,224 | $23,269 |
Source: Public Records
Map
Nearby Homes
- 7820 Highway 193
- 57 Fir St
- 852 Old Grand Center Rd
- 206 Cottage Crest Ct
- 0 Maple Hill Rd Unit 7527469
- 0 Maple Hill Rd Unit LOT 9A 10467227
- 60 Red Oak Ridge Dr
- 1080 Harp Switch Rd
- 426 Simmons Tawzer Rd
- 0 Cloudland Unit 1510868
- 0 Cloudland Unit 1520617
- 0 Roundtree Ct Unit 1514898
- 0 Roundtree Ct Unit RTC2914889
- 301 Hidden Oaks Dr
- 433 Stanford Dr
- 780 Marble Top Rd
- 810 Marble Top Rd
- 1907 Grand Center Rd
- 458 Boss Rd
- 144 N Victor Dr
- 8175 Highway 193
- 16 Buckner Rd
- 8114 Highway 193
- 57 Parrish Ln
- 8163 Highway 193
- 8086 Highway 193
- 8208 Highway 193
- 68 Buckner Rd
- 16 Parrish Ln
- 8232 Hwy 193
- 8055 Highway 193
- 12 Oliver Ln
- 57 Oliver Ln
- 8262 Highway 193
- 112 Farm House Ln
- 8267 Highway 193
- 87 Oliver Ln
- 130 Parrish Ln
- 115 Oliver Ln
- 7978 Highway 193