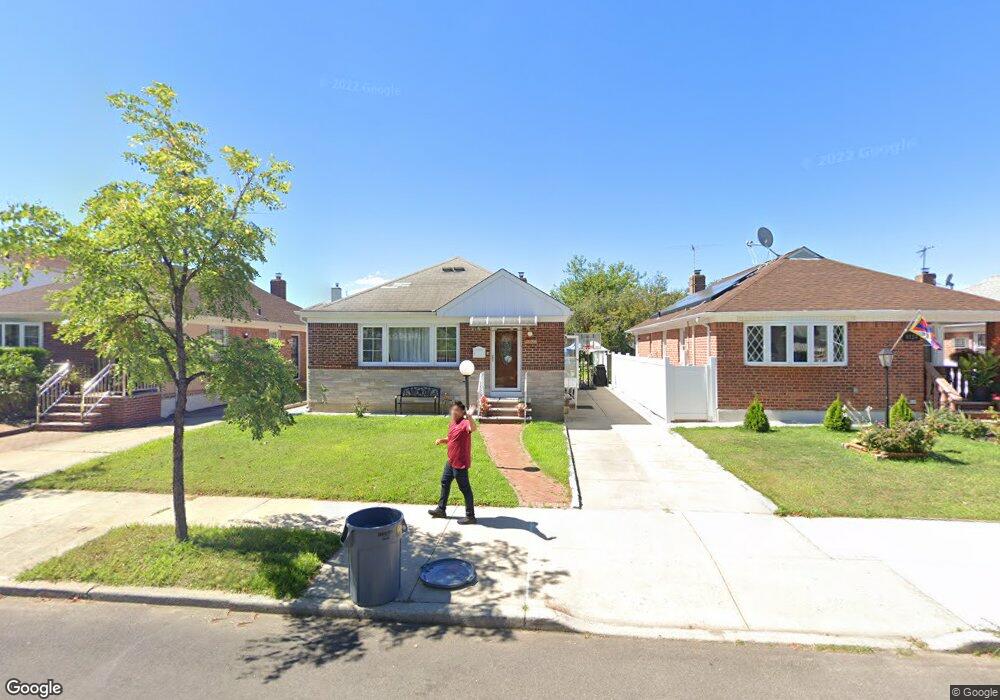
8128 255th St Glen Oaks, NY 11004
Estimated Value: $822,103 - $898,000
--
Bed
--
Bath
1,150
Sq Ft
$761/Sq Ft
Est. Value
About This Home
This home is located at 8128 255th St, Glen Oaks, NY 11004 and is currently estimated at $875,276, approximately $761 per square foot. 8128 255th St is a home located in Queens County with nearby schools including P.S.115Q James J Ambrose School, Irwin Altman Middle School 172, and Martin Van Buren High School.
Ownership History
Date
Name
Owned For
Owner Type
Purchase Details
Closed on
Jul 31, 2025
Sold by
Deonarine Balvinder and Deonarine Devanand
Bought by
4D 8128 Capital Llc
Current Estimated Value
Home Financials for this Owner
Home Financials are based on the most recent Mortgage that was taken out on this home.
Original Mortgage
$593,000
Outstanding Balance
$592,481
Interest Rate
6.67%
Mortgage Type
Purchase Money Mortgage
Estimated Equity
$282,795
Purchase Details
Closed on
Jun 28, 2017
Sold by
Talansky Irene and % Cooperman Lester Miller Carus Llp
Bought by
Deonarine Balvinder and Deonarine Devanand
Home Financials for this Owner
Home Financials are based on the most recent Mortgage that was taken out on this home.
Original Mortgage
$456,000
Interest Rate
3.94%
Mortgage Type
New Conventional
Purchase Details
Closed on
Mar 31, 1994
Sold by
Talansky Irene
Bought by
Talansky Irene and Talansky Kalman
Create a Home Valuation Report for This Property
The Home Valuation Report is an in-depth analysis detailing your home's value as well as a comparison with similar homes in the area
Home Values in the Area
Average Home Value in this Area
Purchase History
| Date | Buyer | Sale Price | Title Company |
|---|---|---|---|
| 4D 8128 Capital Llc | -- | -- | |
| Deonarine Balvinder | $570,000 | -- | |
| Deonarine Balvinder | $570,000 | -- | |
| Talansky Irene | -- | -- | |
| Talansky Irene | -- | -- |
Source: Public Records
Mortgage History
| Date | Status | Borrower | Loan Amount |
|---|---|---|---|
| Open | 4D 8128 Capital Llc | $593,000 | |
| Previous Owner | Deonarine Balvinder | $456,000 |
Source: Public Records
Tax History Compared to Growth
Tax History
| Year | Tax Paid | Tax Assessment Tax Assessment Total Assessment is a certain percentage of the fair market value that is determined by local assessors to be the total taxable value of land and additions on the property. | Land | Improvement |
|---|---|---|---|---|
| 2025 | $8,516 | $44,945 | $13,976 | $30,969 |
| 2024 | $8,516 | $42,402 | $14,028 | $28,374 |
| 2023 | $8,035 | $40,003 | $11,879 | $28,124 |
| 2022 | $7,986 | $48,000 | $15,840 | $32,160 |
| 2021 | $8,355 | $44,340 | $15,840 | $28,500 |
| 2020 | $7,928 | $41,100 | $15,840 | $25,260 |
| 2019 | $7,392 | $41,880 | $15,840 | $26,040 |
| 2018 | $6,796 | $33,336 | $13,581 | $19,755 |
| 2017 | $6,395 | $33,336 | $14,264 | $19,072 |
| 2016 | $5,881 | $33,336 | $14,264 | $19,072 |
| 2015 | $3,342 | $31,212 | $14,200 | $17,012 |
| 2014 | $3,342 | $29,446 | $16,066 | $13,380 |
Source: Public Records
Map
Nearby Homes
- 8112 255th St
- 8127 252nd St
- 8132 252nd St
- 252-14 82nd Rd
- 8017 252nd St
- 8013 252nd St
- 250-12 81st Ave
- 82-16 251st St
- 81-42 250th St
- 81-31 259th St
- 80-37 259th St
- 83-29 Little Neck Pkwy
- 82-65 250th St
- 83-04 251st St
- 258-15 83rd Ave
- 8151 248th St
- 8049 260th St
- 7734 Little Neck Pkwy
- 80-01 249th St
- 7719 252nd St