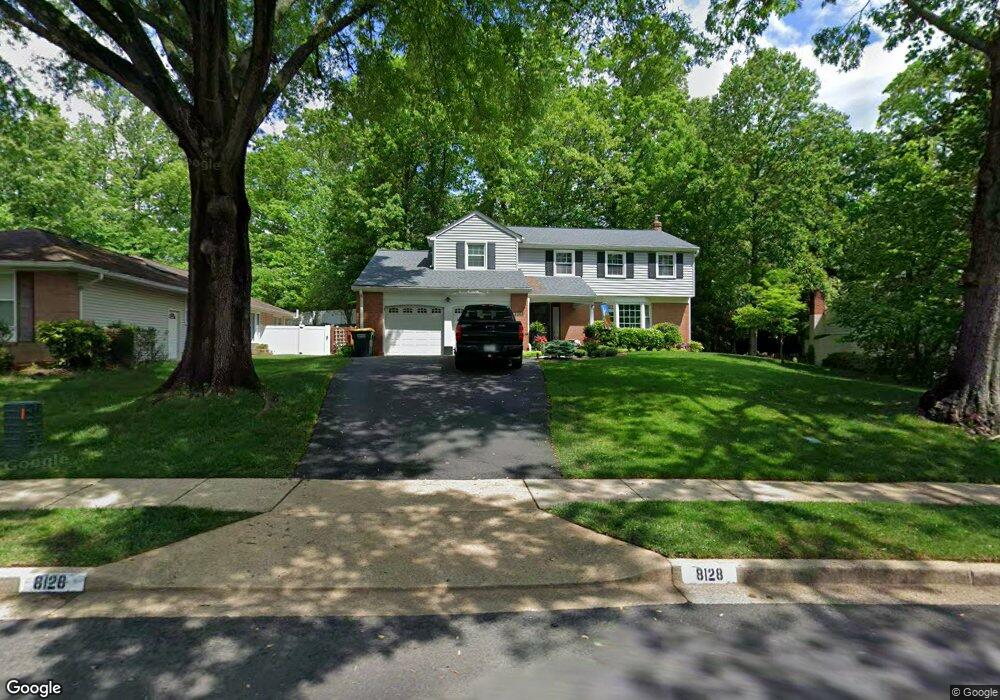
8128 Langbrook Rd Springfield, VA 22152
Estimated Value: $918,000 - $945,000
4
Beds
3
Baths
2,574
Sq Ft
$363/Sq Ft
Est. Value
About This Home
This home is located at 8128 Langbrook Rd, Springfield, VA 22152 and is currently estimated at $934,317, approximately $362 per square foot. 8128 Langbrook Rd is a home located in Fairfax County with nearby schools including Cardinal Forest Elementary School, Irving Middle School, and West Springfield High School.
Ownership History
Date
Name
Owned For
Owner Type
Purchase Details
Closed on
Dec 13, 2022
Sold by
Foland James M and Foland Betsy E
Bought by
James And Betsy Foland Trust
Current Estimated Value
Purchase Details
Closed on
Oct 4, 1995
Sold by
Landry Roger G
Bought by
Foland James M
Home Financials for this Owner
Home Financials are based on the most recent Mortgage that was taken out on this home.
Original Mortgage
$235,600
Interest Rate
7.86%
Create a Home Valuation Report for This Property
The Home Valuation Report is an in-depth analysis detailing your home's value as well as a comparison with similar homes in the area
Home Values in the Area
Average Home Value in this Area
Purchase History
| Date | Buyer | Sale Price | Title Company |
|---|---|---|---|
| James And Betsy Foland Trust | -- | -- | |
| Foland James M | $248,000 | -- |
Source: Public Records
Mortgage History
| Date | Status | Borrower | Loan Amount |
|---|---|---|---|
| Previous Owner | Foland James M | $235,600 |
Source: Public Records
Tax History
| Year | Tax Paid | Tax Assessment Tax Assessment Total Assessment is a certain percentage of the fair market value that is determined by local assessors to be the total taxable value of land and additions on the property. | Land | Improvement |
|---|---|---|---|---|
| 2025 | $9,759 | $881,670 | $307,000 | $574,670 |
| 2024 | $9,759 | $842,350 | $287,000 | $555,350 |
| 2023 | $8,926 | $790,940 | $267,000 | $523,940 |
| 2022 | $8,619 | $753,770 | $252,000 | $501,770 |
| 2021 | $7,600 | $647,670 | $212,000 | $435,670 |
| 2020 | $7,555 | $638,360 | $207,000 | $431,360 |
| 2019 | $7,215 | $609,670 | $202,000 | $407,670 |
| 2018 | $6,923 | $601,960 | $202,000 | $399,960 |
| 2017 | $6,827 | $588,040 | $202,000 | $386,040 |
| 2016 | $6,640 | $573,190 | $202,000 | $371,190 |
Source: Public Records
Map
Nearby Homes
- 8142 Carrleigh Pkwy Unit 126
- 5927 Bayshire Rd Unit 115
- 8141 Kingsway Ct Unit 289
- 8210 Carrleigh Pkwy Unit 6
- 8222 Carrleigh Pkwy Unit 12
- 8230 Carrleigh Pkwy Unit 84
- 8205 Dabney Ave
- 5912 Minutemen Rd Unit 295
- 5913 Prince James Dr Unit J
- 8231K Kings Charter Ln Unit 108
- 8330 Darlington St Unit 467
- 8312G Kingsgate Rd Unit 532
- 5902-B Queenston St Unit 505
- 8396 Forrester Blvd Unit 555
- 8360B Dunham Ct Unit 630
- 5898G Surrey Hill Place Unit 684
- 5845 Rexford Dr Unit 721
- 5772 Rexford Ct
- 8503 Forrester Blvd
- 5824 Rexford Dr Unit 731
- 8200 Langbrook Rd
- 8126 Langbrook Rd
- 8202 Langbrook Rd
- 8124 Langbrook Rd
- 6023 Talford Ct
- 8127 Langbrook Rd
- 8201 Langbrook Rd
- 6021 Talford Ct
- 8125 Langbrook Rd
- 6019 Talford Ct
- 8122 Langbrook Rd
- 8204 Langbrook Rd
- 8203 Langbrook Rd
- 6017 Talford Ct
- 6014 Talford Ct
- 8123 Langbrook Rd
- 6015 Talford Ct
- 6028 Haverhill Ct
- 6012 Talford Ct
- 6013 Talford Ct
Your Personal Tour Guide
Ask me questions while you tour the home.