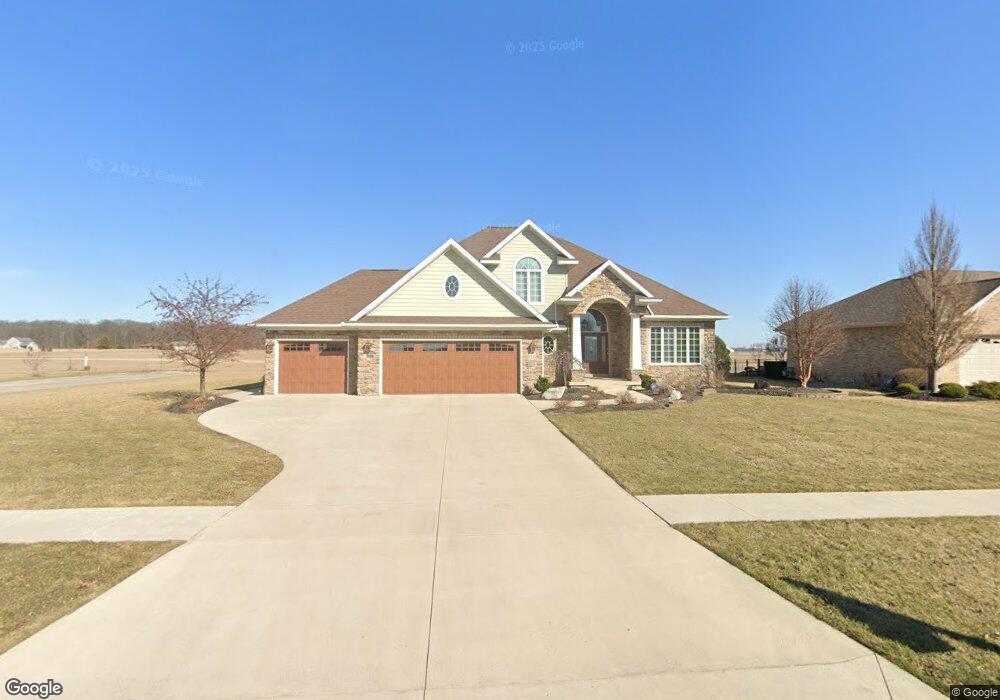
8129 Ash Ridge Ln Findlay, OH 45840
Estimated Value: $568,000 - $582,000
4
Beds
5
Baths
2,780
Sq Ft
$207/Sq Ft
Est. Value
About This Home
This home is located at 8129 Ash Ridge Ln, Findlay, OH 45840 and is currently estimated at $574,554, approximately $206 per square foot. 8129 Ash Ridge Ln is a home located in Hancock County with nearby schools including Wilson Vance Elementary School, Whittier Elementary School, and Glenwood Middle School.
Ownership History
Date
Name
Owned For
Owner Type
Purchase Details
Closed on
Jan 14, 2011
Sold by
Macke Stanley L
Bought by
Warren David M and Warren Amy B
Current Estimated Value
Home Financials for this Owner
Home Financials are based on the most recent Mortgage that was taken out on this home.
Original Mortgage
$342,000
Outstanding Balance
$231,711
Interest Rate
4.65%
Mortgage Type
New Conventional
Estimated Equity
$342,843
Purchase Details
Closed on
May 14, 2010
Sold by
Wappelhorst Jeffrey L and Wappelhorst Natasha L
Bought by
Macke Stanley L
Purchase Details
Closed on
Dec 16, 2005
Sold by
Weinko Inc
Bought by
Wappelhorst Jeffrey L and Wappelhorst Natasha L
Home Financials for this Owner
Home Financials are based on the most recent Mortgage that was taken out on this home.
Original Mortgage
$39,015
Interest Rate
6.36%
Mortgage Type
Unknown
Create a Home Valuation Report for This Property
The Home Valuation Report is an in-depth analysis detailing your home's value as well as a comparison with similar homes in the area
Home Values in the Area
Average Home Value in this Area
Purchase History
| Date | Buyer | Sale Price | Title Company |
|---|---|---|---|
| Warren David M | $380,000 | Mid Am Title Agency | |
| Macke Stanley L | $42,500 | Mid Am Title Agency | |
| Wappelhorst Jeffrey L | $45,900 | Abstract Title Co |
Source: Public Records
Mortgage History
| Date | Status | Borrower | Loan Amount |
|---|---|---|---|
| Open | Warren David M | $342,000 | |
| Previous Owner | Wappelhorst Jeffrey L | $39,015 |
Source: Public Records
Tax History Compared to Growth
Tax History
| Year | Tax Paid | Tax Assessment Tax Assessment Total Assessment is a certain percentage of the fair market value that is determined by local assessors to be the total taxable value of land and additions on the property. | Land | Improvement |
|---|---|---|---|---|
| 2024 | $5,947 | $166,830 | $27,630 | $139,200 |
| 2023 | $5,956 | $166,830 | $27,630 | $139,200 |
| 2022 | $5,935 | $166,830 | $27,630 | $139,200 |
| 2021 | $6,045 | $147,620 | $15,790 | $131,830 |
| 2020 | $6,044 | $147,620 | $15,790 | $131,830 |
| 2019 | $5,923 | $147,620 | $15,790 | $131,830 |
| 2018 | $5,601 | $127,790 | $13,150 | $114,640 |
| 2017 | $5,602 | $127,790 | $13,150 | $114,640 |
| 2016 | $5,493 | $127,790 | $13,150 | $114,640 |
| 2015 | $5,578 | $126,450 | $13,880 | $112,570 |
| 2014 | $5,452 | $126,450 | $13,880 | $112,570 |
| 2012 | $5,487 | $126,450 | $13,880 | $112,570 |
Source: Public Records
Map
Nearby Homes
- 16078 Forest Lake Dr
- 8130 Shawnee Forest Dr
- 8100 Shawnee Forest Dr
- 0 Forest Ln Unit Lot 258
- 8499 Indian Lake Dr
- 8405 Indian Lake Dr
- 0 Hickory Ln Unit 1 307878
- 0 Hickory Ln Unit 20252999
- 0 Hickory Ln Unit 1
- 0 Lakeside Dr
- 7752 E Point Dr
- 8419 E Woodland Trail
- 7665 Brookstone Dr
- 7507 Township Road 212
- 7633 Brookstone Dr
- 0 E Us Route 224
- 15329 E Us Route 224
- 7711 E Watermark Dr
- 15711 Mahogany Trail Unit U10-D
- 0 Meadowview Dr
- 8147 Ash Ridge Ln
- 8099 Ash Ridge Ln
- 8163 Ash Ridge Ln
- 8128 Ash Ridge Ln
- 8146 Ash Ridge Ln
- 8162 Ash Ridge Ln
- 16208 Forest Edge Dr
- 16189 Forest Edge Dr
- 8081 Ash Ridge Ln
- 8179 Ash Ridge Ln
- 16188 Forest Edge Dr
- 8178 Ash Ridge Ln
- 16173 Forest Edge Dr
- 8195 Ash Ridge Ln
- 16065 Lakeside Ct
- 16209 Forest Ln
- 16172 Forest Edge Dr
- 8194 Ash Ridge Ln
- 16157 Forest Edge Dr
- 8211 Ash Ridge Ln