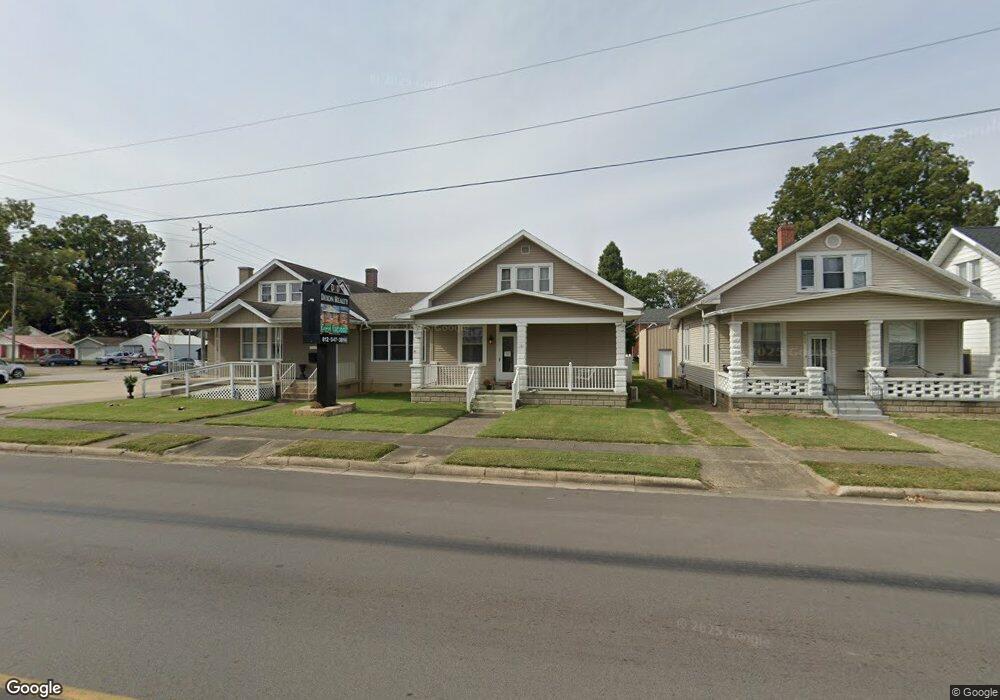
813 12th St Tell City, IN 47586
Estimated Value: $119,000 - $132,000
4
Beds
1
Bath
1,440
Sq Ft
$86/Sq Ft
Est. Value
About This Home
This home is located at 813 12th St, Tell City, IN 47586 and is currently estimated at $124,165, approximately $86 per square foot. 813 12th St is a home located in Perry County with nearby schools including William Tell Elementary School, Tell City Junior/Senior High School, and Agape Christian Academy.
Ownership History
Date
Name
Owned For
Owner Type
Purchase Details
Closed on
Feb 12, 2019
Sold by
Chapman Claire A
Bought by
Dixon Norman Scott and Dixon Heidi K
Current Estimated Value
Home Financials for this Owner
Home Financials are based on the most recent Mortgage that was taken out on this home.
Original Mortgage
$66,300
Outstanding Balance
$55,239
Interest Rate
4.5%
Mortgage Type
Future Advance Clause Open End Mortgage
Estimated Equity
$68,926
Purchase Details
Closed on
Oct 17, 2012
Sold by
Ransom Clarence J
Bought by
Ransom Claire A
Create a Home Valuation Report for This Property
The Home Valuation Report is an in-depth analysis detailing your home's value as well as a comparison with similar homes in the area
Home Values in the Area
Average Home Value in this Area
Purchase History
| Date | Buyer | Sale Price | Title Company |
|---|---|---|---|
| Dixon Norman Scott | $78,000 | None Available | |
| Ransom Claire A | -- | -- |
Source: Public Records
Mortgage History
| Date | Status | Borrower | Loan Amount |
|---|---|---|---|
| Open | Dixon Norman Scott | $66,300 |
Source: Public Records
Tax History Compared to Growth
Tax History
| Year | Tax Paid | Tax Assessment Tax Assessment Total Assessment is a certain percentage of the fair market value that is determined by local assessors to be the total taxable value of land and additions on the property. | Land | Improvement |
|---|---|---|---|---|
| 2024 | $1,806 | $90,300 | $8,400 | $81,900 |
| 2023 | $1,738 | $86,900 | $8,400 | $78,500 |
| 2022 | $1,720 | $86,000 | $8,400 | $77,600 |
| 2021 | $1,598 | $79,900 | $4,300 | $75,600 |
| 2020 | $1,488 | $74,400 | $4,300 | $70,100 |
| 2019 | $514 | $72,700 | $4,100 | $68,600 |
| 2018 | $486 | $68,100 | $4,100 | $64,000 |
| 2017 | $463 | $65,500 | $4,100 | $61,400 |
| 2016 | $438 | $61,900 | $4,100 | $57,800 |
| 2014 | $2,238 | $74,600 | $24,700 | $49,900 |
| 2013 | $2,238 | $73,500 | $24,700 | $48,800 |
Source: Public Records
Map
Nearby Homes