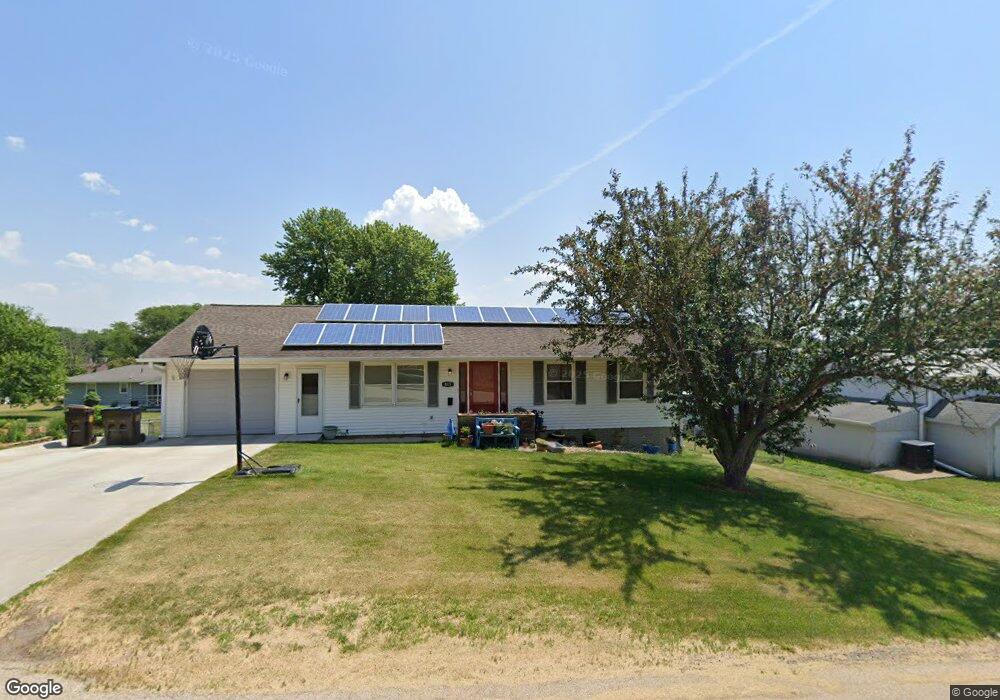
813 16th St Fulton, IL 61252
Estimated Value: $159,000 - $179,000
--
Bed
--
Bath
--
Sq Ft
0.26
Acres
About This Home
This home is located at 813 16th St, Fulton, IL 61252 and is currently estimated at $165,038. 813 16th St is a home located in Whiteside County with nearby schools including Fulton Elementary School, River Bend Middle School, and Fulton High School.
Ownership History
Date
Name
Owned For
Owner Type
Purchase Details
Closed on
Sep 26, 2013
Bought by
Overbeck Jared and Overbeck Catherine
Current Estimated Value
Purchase Details
Closed on
Mar 27, 2012
Sold by
Olsen Susan L
Bought by
Olsen J Darwin
Purchase Details
Closed on
Dec 21, 2009
Sold by
Schreiner Debra D
Bought by
Olsen J Darwin and Olsen Susan
Purchase Details
Closed on
Nov 30, 2009
Sold by
Haan Robert and Haan Nellie
Bought by
Schreiner Debra D
Create a Home Valuation Report for This Property
The Home Valuation Report is an in-depth analysis detailing your home's value as well as a comparison with similar homes in the area
Home Values in the Area
Average Home Value in this Area
Purchase History
| Date | Buyer | Sale Price | Title Company |
|---|---|---|---|
| Overbeck Jared | $118,000 | -- | |
| Olsen J Darwin | -- | None Available | |
| Olsen J Darwin | $75,000 | Nti | |
| Schreiner Debra D | $50,000 | Nti |
Source: Public Records
Tax History Compared to Growth
Tax History
| Year | Tax Paid | Tax Assessment Tax Assessment Total Assessment is a certain percentage of the fair market value that is determined by local assessors to be the total taxable value of land and additions on the property. | Land | Improvement |
|---|---|---|---|---|
| 2024 | $3,046 | $44,005 | $6,579 | $37,426 |
| 2023 | $2,786 | $40,715 | $6,087 | $34,628 |
| 2022 | $2,605 | $37,329 | $5,581 | $31,748 |
| 2021 | $2,545 | $36,437 | $5,448 | $30,989 |
| 2020 | $2,500 | $35,940 | $5,639 | $30,301 |
| 2019 | $2,536 | $35,883 | $5,630 | $30,253 |
| 2018 | $2,407 | $34,862 | $5,470 | $29,392 |
| 2017 | $2,411 | $34,716 | $5,447 | $29,269 |
| 2016 | $2,357 | $33,943 | $5,326 | $28,617 |
| 2015 | $2,674 | $32,720 | $5,134 | $27,586 |
| 2014 | $2,223 | $33,107 | $5,195 | $27,912 |
| 2013 | $2,674 | $32,720 | $5,134 | $27,586 |
Source: Public Records
Map
Nearby Homes