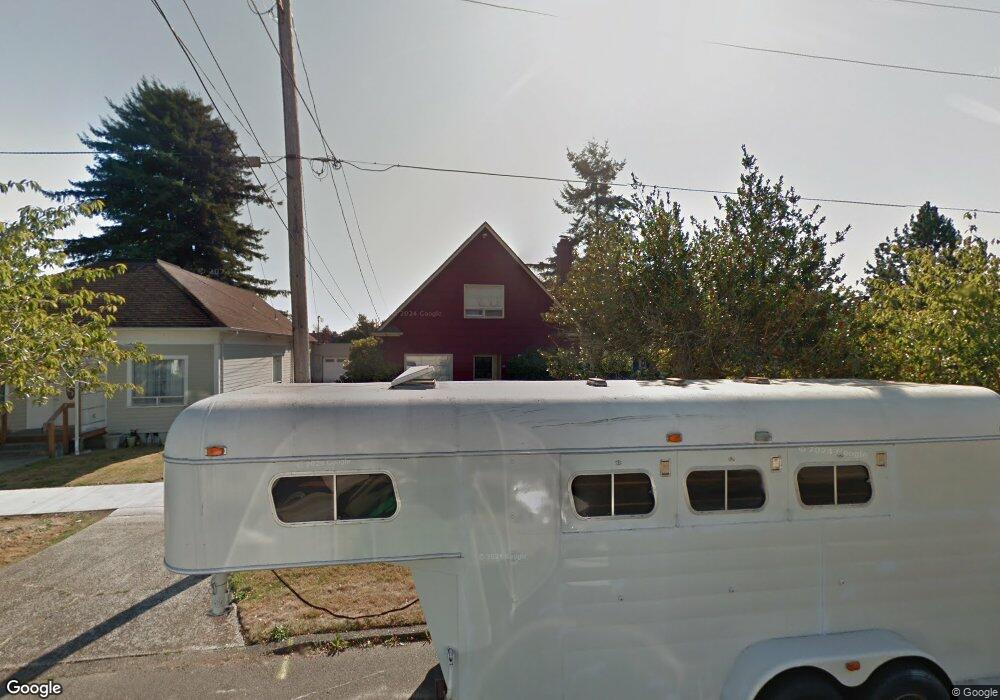
813 3rd St Hoquiam, WA 98550
Estimated Value: $202,879 - $252,000
2
Beds
2
Baths
1,528
Sq Ft
$151/Sq Ft
Est. Value
About This Home
This home is located at 813 3rd St, Hoquiam, WA 98550 and is currently estimated at $229,970, approximately $150 per square foot. 813 3rd St is a home located in Grays Harbor County with nearby schools including Emerson Elementary School, Lincoln Elementary School, and Central Elementary School.
Ownership History
Date
Name
Owned For
Owner Type
Purchase Details
Closed on
Oct 13, 2015
Sold by
Rutledge John P and Rutledge Johnp
Bought by
Rutledge John P and Rutlege Living Trust
Current Estimated Value
Create a Home Valuation Report for This Property
The Home Valuation Report is an in-depth analysis detailing your home's value as well as a comparison with similar homes in the area
Home Values in the Area
Average Home Value in this Area
Purchase History
| Date | Buyer | Sale Price | Title Company |
|---|---|---|---|
| Rutledge John P | -- | None Available |
Source: Public Records
Tax History Compared to Growth
Tax History
| Year | Tax Paid | Tax Assessment Tax Assessment Total Assessment is a certain percentage of the fair market value that is determined by local assessors to be the total taxable value of land and additions on the property. | Land | Improvement |
|---|---|---|---|---|
| 2025 | $1,628 | $172,820 | $27,000 | $145,820 |
| 2023 | $1,807 | $144,793 | $27,000 | $117,793 |
| 2022 | $1,736 | $136,586 | $16,875 | $119,711 |
| 2021 | $1,524 | $136,586 | $16,875 | $119,711 |
| 2020 | $1,350 | $112,644 | $16,875 | $95,769 |
| 2019 | $1,111 | $96,683 | $16,875 | $79,808 |
| 2018 | $1,114 | $83,381 | $16,875 | $66,506 |
| 2017 | $1,062 | $70,080 | $16,875 | $53,205 |
| 2016 | $1,051 | $70,080 | $16,875 | $53,205 |
| 2014 | -- | $69,800 | $16,875 | $52,925 |
| 2013 | -- | $70,665 | $16,875 | $53,790 |
Source: Public Records
Map
Nearby Homes