
Seller's Agent in 2023
Cyndi Byrley
ERA FIRST ADVANTAGE REALTY, INC
(812) 457-4663
78 in this area
318 Total Sales
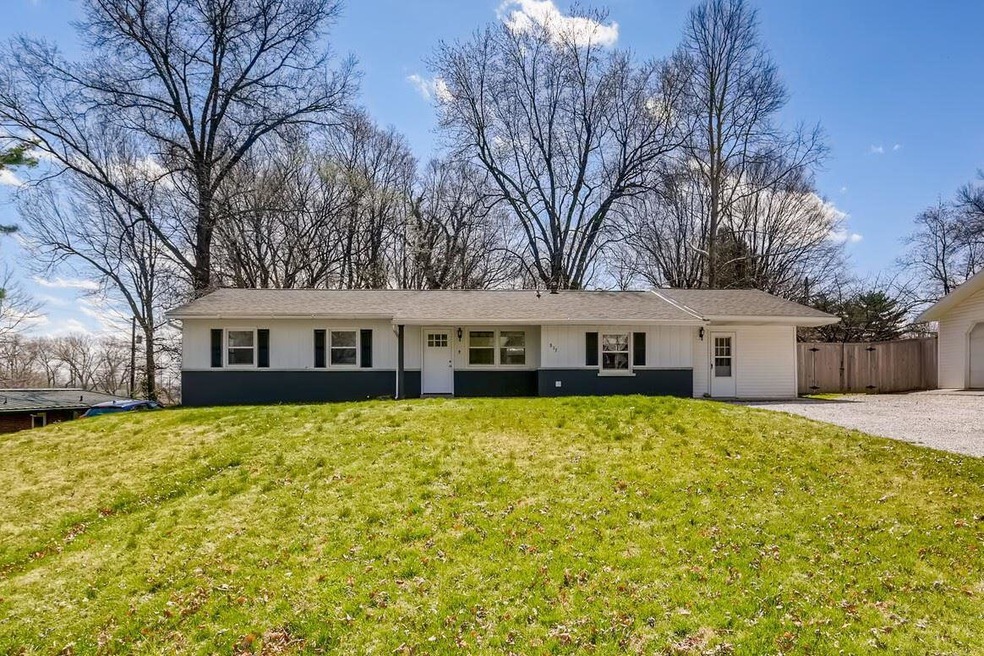
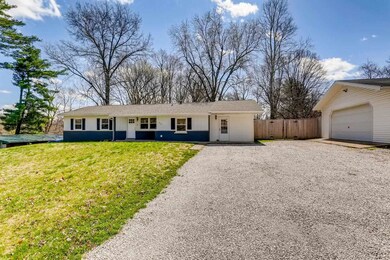
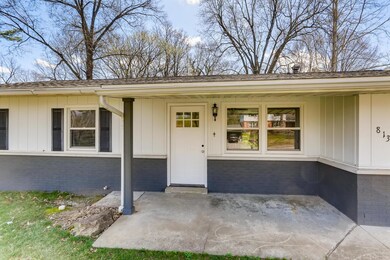
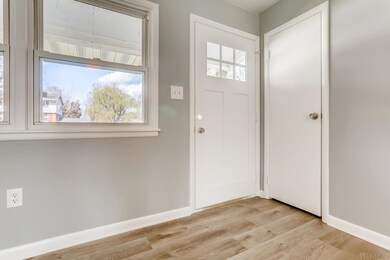
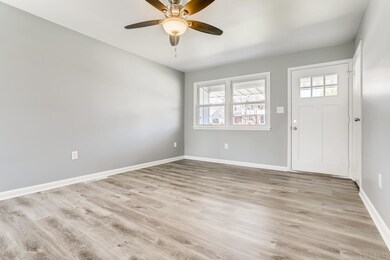
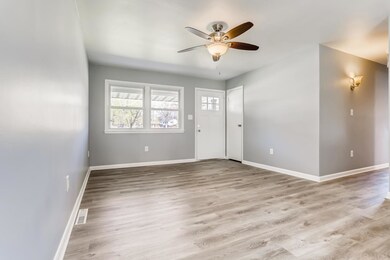
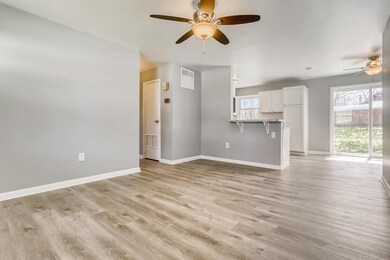
Completely updated 4-bedroom, 2-bath home on a large lot with a 2.5-car detached garage. This stunning home offers an open floor plan with a spacious great room open to the eat-in kitchen with stainless appliances and a dining area overlooking the back yard. There is also a family room for added entertaining space, and a mud room with separate entry. The master suite features a full bath and an over-sized walk-in closet. Three additional bedrooms and a second full bath complete the home's floor plan. Outside is a huge, fully-fenced back yard with mature trees and an abundance of space for outdoor entertaining and recreation. The detached 2.5-car garage and large gravel driveway offer plenty of parking and storage space for your outdoor essentials. This home is sure to impress!
Last Agent to Sell the Property
Gene Lechner
@properties Listed on: 03/30/2021
| Date | Type | Sale Price | Title Company |
|---|---|---|---|
| Warranty Deed | $245,000 | None Listed On Document | |
| Warranty Deed | $225,000 | Near North Title Group | |
| Warranty Deed | -- | None Available | |
| Warranty Deed | -- | None Available |
| Date | Status | Loan Amount | Loan Type |
|---|---|---|---|
| Open | $253,085 | VA | |
| Previous Owner | $96,000 | New Conventional | |
| Previous Owner | $88,000 | Adjustable Rate Mortgage/ARM |
| Date | Event | Price | Change | Sq Ft Price |
|---|---|---|---|---|
| 06/12/2023 06/12/23 | Sold | $245,000 | +4.5% | $138 / Sq Ft |
| 05/10/2023 05/10/23 | Pending | -- | -- | -- |
| 04/27/2023 04/27/23 | Price Changed | $234,500 | -2.1% | $132 / Sq Ft |
| 04/11/2023 04/11/23 | Price Changed | $239,500 | -4.0% | $135 / Sq Ft |
| 04/05/2023 04/05/23 | For Sale | $249,500 | +10.9% | $141 / Sq Ft |
| 07/07/2021 07/07/21 | Sold | $225,000 | -4.3% | $127 / Sq Ft |
| 06/05/2021 06/05/21 | Pending | -- | -- | -- |
| 05/05/2021 05/05/21 | For Sale | $235,000 | 0.0% | $132 / Sq Ft |
| 04/13/2021 04/13/21 | Pending | -- | -- | -- |
| 03/30/2021 03/30/21 | For Sale | $235,000 | +95.8% | $132 / Sq Ft |
| 06/02/2020 06/02/20 | Sold | $120,000 | -7.7% | $68 / Sq Ft |
| 04/15/2020 04/15/20 | Pending | -- | -- | -- |
| 03/19/2020 03/19/20 | For Sale | $130,000 | -- | $73 / Sq Ft |
| Year | Tax Paid | Tax Assessment Tax Assessment Total Assessment is a certain percentage of the fair market value that is determined by local assessors to be the total taxable value of land and additions on the property. | Land | Improvement |
|---|---|---|---|---|
| 2024 | $2,048 | $214,900 | $53,200 | $161,700 |
| 2023 | $1,956 | $218,400 | $53,200 | $165,200 |
| 2022 | $1,297 | $149,000 | $28,300 | $120,700 |
| 2021 | $1,051 | $119,200 | $22,700 | $96,500 |
| 2020 | $966 | $113,200 | $22,700 | $90,500 |
| 2019 | $1,021 | $116,900 | $22,700 | $94,200 |
| 2018 | $940 | $111,000 | $22,700 | $88,300 |
| 2017 | $909 | $107,900 | $22,700 | $85,200 |
| 2016 | $826 | $107,400 | $22,700 | $84,700 |
| 2014 | $879 | $116,400 | $24,000 | $92,400 |
| 2013 | $866 | $117,400 | $24,000 | $93,400 |
Seller's Agent in 2023
Cyndi Byrley
ERA FIRST ADVANTAGE REALTY, INC
(812) 457-4663
78 in this area
318 Total Sales
Buyer's Agent in 2023
Jerrod Eagleson
KELLER WILLIAMS CAPITAL REALTY
(812) 305-2732
33 in this area
413 Total Sales
G
Seller's Agent in 2021
Gene Lechner
@properties
Seller Co-Listing Agent in 2021
Chris Schafer
@properties
(812) 430-9630
36 in this area
132 Total Sales
Buyer's Agent in 2021
Tim Mason
RE/MAX
(812) 664-0845
7 in this area
395 Total Sales
Seller's Agent in 2020
Trae Dauby
Dauby Real Estate
(812) 213-4859
122 in this area
1,536 Total Sales
Source: Indiana Regional MLS
MLS Number: 202110218
APN: 87-12-33-401-024.000-014
Disclaimer: Certain information contained herein is derived from information provided by parties other than Homes.com. All information provided is deemed reliable, but is not guaranteed to be accurate and should be independently verified.
![]() IDX information is provided exclusively for personal, non-commercial use, and may not be used for any purpose other than to identify prospective properties consumers may be interested in purchasing. Information is deemed reliable but not guaranteed.
IDX information is provided exclusively for personal, non-commercial use, and may not be used for any purpose other than to identify prospective properties consumers may be interested in purchasing. Information is deemed reliable but not guaranteed.