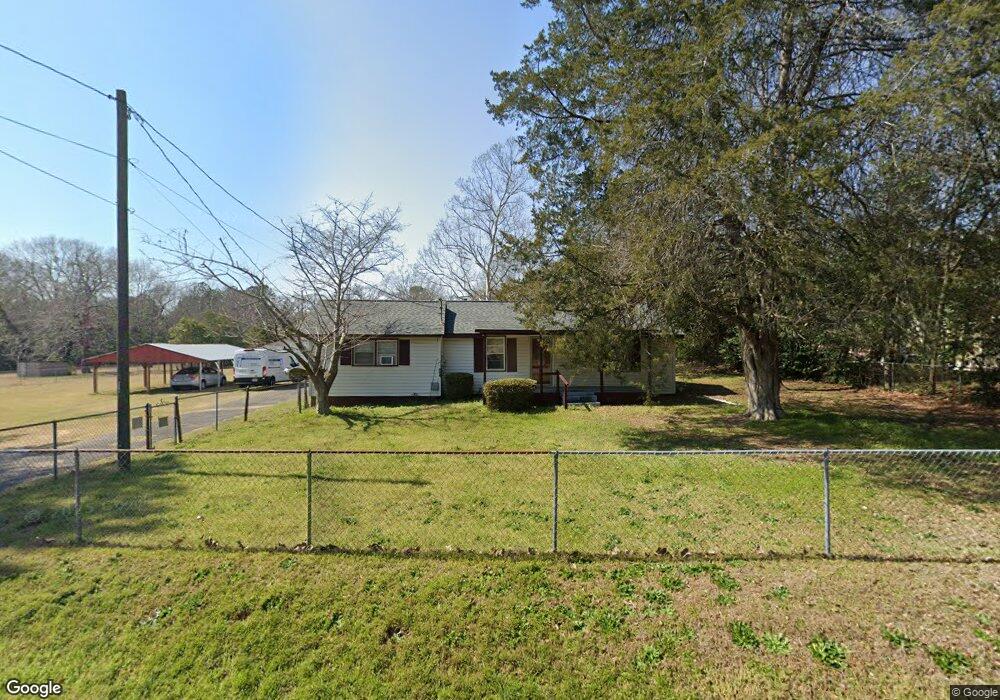
813 Collins Ave Warner Robins, GA 31093
Estimated Value: $125,000 - $182,477
3
Beds
2
Baths
1,264
Sq Ft
$125/Sq Ft
Est. Value
About This Home
This home is located at 813 Collins Ave, Warner Robins, GA 31093 and is currently estimated at $158,619, approximately $125 per square foot. 813 Collins Ave is a home located in Houston County with nearby schools including Centerville Elementary School, Thomson Middle School, and Northside High School.
Ownership History
Date
Name
Owned For
Owner Type
Purchase Details
Closed on
Feb 11, 2020
Sold by
Hill Melody J
Bought by
Hill Brian Kelly
Current Estimated Value
Purchase Details
Closed on
Nov 15, 2013
Sold by
Young Shelva Jean
Bought by
Hill Melody J
Purchase Details
Closed on
Oct 12, 2001
Sold by
Young Shelva Jean and Young Riley
Bought by
Young Shelva Jean
Purchase Details
Closed on
Nov 1, 1991
Sold by
Young Shelva Jean
Bought by
Young Shelva Jean and Young Riley
Purchase Details
Closed on
Sep 20, 1985
Sold by
Presley Shelva Jean
Bought by
Young Shelva Jean
Purchase Details
Closed on
Mar 12, 1984
Sold by
Presley Joe E and Shelva Jean*
Bought by
Presley Shelva Jean
Purchase Details
Closed on
Aug 31, 1982
Sold by
Presley Joe E
Bought by
Presley Joe E and Shelva Jean*
Purchase Details
Closed on
May 14, 1963
Bought by
Presley Joe E
Create a Home Valuation Report for This Property
The Home Valuation Report is an in-depth analysis detailing your home's value as well as a comparison with similar homes in the area
Home Values in the Area
Average Home Value in this Area
Purchase History
| Date | Buyer | Sale Price | Title Company |
|---|---|---|---|
| Hill Brian Kelly | -- | None Available | |
| Hill Melody J | -- | -- | |
| Young Shelva Jean | -- | -- | |
| Young Shelva Jean | -- | -- | |
| Young Shelva Jean | -- | -- | |
| Presley Shelva Jean | -- | -- | |
| Presley Joe E | -- | -- | |
| Presley Joe E | -- | -- |
Source: Public Records
Tax History Compared to Growth
Tax History
| Year | Tax Paid | Tax Assessment Tax Assessment Total Assessment is a certain percentage of the fair market value that is determined by local assessors to be the total taxable value of land and additions on the property. | Land | Improvement |
|---|---|---|---|---|
| 2024 | $1,662 | $47,920 | $10,000 | $37,920 |
| 2023 | $1,539 | $44,040 | $12,800 | $31,240 |
| 2022 | $948 | $41,240 | $12,800 | $28,440 |
| 2021 | $834 | $36,080 | $10,000 | $26,080 |
| 2020 | $934 | $26,480 | $7,960 | $18,520 |
| 2019 | $615 | $26,480 | $7,960 | $18,520 |
| 2018 | $615 | $26,480 | $7,960 | $18,520 |
| 2017 | $616 | $26,480 | $7,960 | $18,520 |
| 2016 | $618 | $26,480 | $7,960 | $18,520 |
| 2015 | $618 | $26,480 | $7,960 | $18,520 |
| 2014 | -- | $26,480 | $7,960 | $18,520 |
Source: Public Records
Map
Nearby Homes
- 305 Brantley Rd Unit 6
- 202 Brantley Rd
- 224 Crestwood Cir
- 111 Shamrock Dr
- 118 Ridgewood Dr
- 200 Collins Estate Ave
- 918 Collins Ave Unit 36
- 404 Collins Estate Ave
- 402 Collins Estate Ave
- 708 N Houston Lake Blvd
- 106 Maple Glen Ct
- 205 Cambridge Dr
- 0 N Houston Lake Blvd
- 0 N Houston Lake Blvd Unit 10307131
- 213 Dogwood Glen
- 111 Red Oak Glen
- 102 Pine Glen Ct
- 101 Kent Dr
- 811 Collins Ave
- 817 Collins Ave
- 819 Collins Ave
- 127 Benjamin Rd
- 805 Collins Ave
- 804 Collins Ave
- 821 Collins Ave
- 818 Collins Ave
- 100 Weaver Rd
- 125 Benjamin Rd
- 823 Collins Ave
- 102 Weaver Rd
- 216 Brantley Rd
- 101 Weaver Rd
- 827 Collins Ave
- 709 Collins Ave
- 104 Weaver Rd
- 810 Collins Ave
- 105 Crestwood Rd
- 106 Weaver Rd