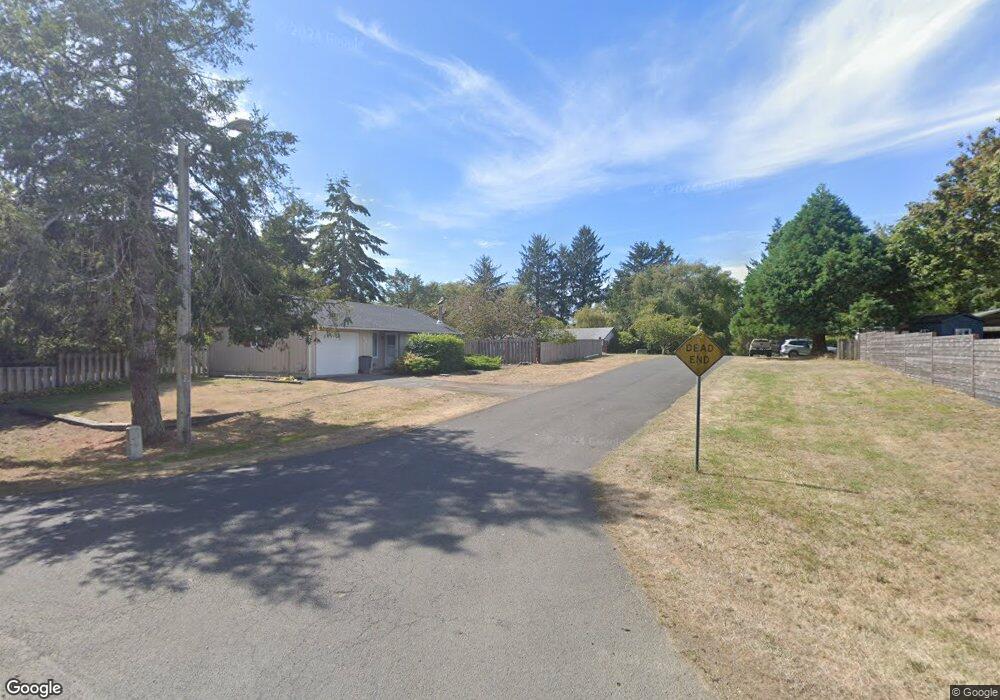
813 D St Seaside, OR 97138
Estimated Value: $476,946 - $634,000
3
Beds
--
Bath
1,288
Sq Ft
$425/Sq Ft
Est. Value
About This Home
This home is located at 813 D St, Seaside, OR 97138 and is currently estimated at $547,987, approximately $425 per square foot. 813 D St is a home located in Clatsop County with nearby schools including Seaside High School.
Ownership History
Date
Name
Owned For
Owner Type
Purchase Details
Closed on
Nov 3, 2006
Sold by
Britton Ronald Frederick
Bought by
Britton Ronald Frederick and Britton Linda E
Current Estimated Value
Home Financials for this Owner
Home Financials are based on the most recent Mortgage that was taken out on this home.
Original Mortgage
$189,500
Interest Rate
6.44%
Mortgage Type
New Conventional
Purchase Details
Closed on
Oct 10, 2006
Sold by
Britton Ronald and Britton Linda
Bought by
Britton Ronald Fredrick
Home Financials for this Owner
Home Financials are based on the most recent Mortgage that was taken out on this home.
Original Mortgage
$189,500
Interest Rate
6.44%
Mortgage Type
New Conventional
Purchase Details
Closed on
Jan 18, 2005
Sold by
Britton Ron and Britton Linda
Bought by
Britton Ronald and Britton Linda
Home Financials for this Owner
Home Financials are based on the most recent Mortgage that was taken out on this home.
Original Mortgage
$160,000
Interest Rate
5.67%
Mortgage Type
New Conventional
Create a Home Valuation Report for This Property
The Home Valuation Report is an in-depth analysis detailing your home's value as well as a comparison with similar homes in the area
Purchase History
| Date | Buyer | Sale Price | Title Company |
|---|---|---|---|
| Britton Ronald Frederick | -- | Ticor Title Ins Co | |
| Britton Ronald Fredrick | -- | Ticor Title Ins Co | |
| Britton Ronald | -- | Ticor Title Ins Co |
Source: Public Records
Mortgage History
| Date | Status | Borrower | Loan Amount |
|---|---|---|---|
| Closed | Britton Ronald Fredrick | $189,500 | |
| Closed | Britton Ronald | $160,000 |
Source: Public Records
Tax History
| Year | Tax Paid | Tax Assessment Tax Assessment Total Assessment is a certain percentage of the fair market value that is determined by local assessors to be the total taxable value of land and additions on the property. | Land | Improvement |
|---|---|---|---|---|
| 2025 | $2,959 | $270,853 | -- | -- |
| 2024 | $3,008 | $262,965 | -- | -- |
| 2023 | $3,016 | $263,383 | $0 | $0 |
| 2022 | $2,925 | $255,713 | $0 | $0 |
| 2021 | $2,986 | $248,266 | $0 | $0 |
| 2020 | $2,881 | $241,036 | $0 | $0 |
| 2019 | $2,806 | $234,016 | $0 | $0 |
Source: Public Records
Map
Nearby Homes
- 1265 D St
- 1255 A St
- 782 Woodland Ct
- 934 H St
- 3387-3389 U S 101
- 3389 U S 101
- 735 3rd St
- 641 6th St
- 2674 U S 101
- 2657 N Hwy 101 Unit 6
- 1396 N Ocean Ave
- 802 25th Ave
- 0 8th St
- 0 McCormick Gardens Rd
- 777 N Marion Ave
- 2440 Pine St
- 2550 Boehm Acres Rd
- 0 Cross Creek St Unit 14
- 0 Cross Creek St Unit 13
- 0 Cross Creek St Unit 26-112
Your Personal Tour Guide
Ask me questions while you tour the home.