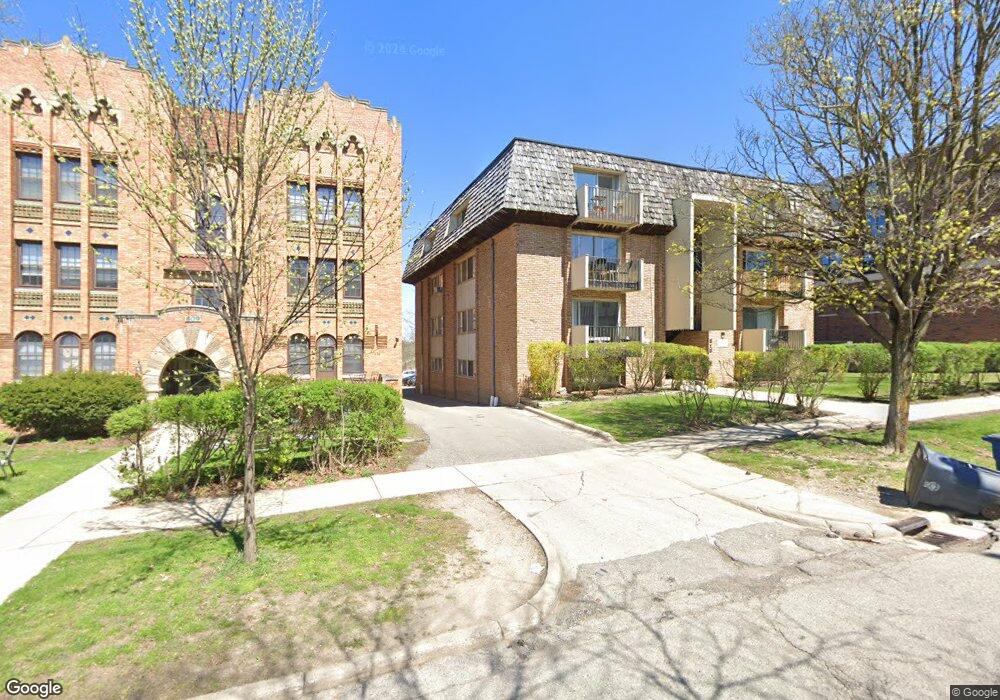
813 E Kingsley St Unit D4 Ann Arbor, MI 48104
Old Fourth Ward NeighborhoodEstimated Value: $260,308 - $387,000
2
Beds
1
Bath
698
Sq Ft
$445/Sq Ft
Est. Value
About This Home
This home is located at 813 E Kingsley St Unit D4, Ann Arbor, MI 48104 and is currently estimated at $310,827, approximately $445 per square foot. 813 E Kingsley St Unit D4 is a home located in Washtenaw County with nearby schools including Bach Elementary School, Slauson Middle School, and Skyline High School.
Ownership History
Date
Name
Owned For
Owner Type
Purchase Details
Closed on
Nov 4, 2006
Sold by
Fan Hua Tzu and Wang Jui Chao
Bought by
H T Fan Llc
Current Estimated Value
Purchase Details
Closed on
Aug 3, 2006
Sold by
Madadi Surender Rao and Rao Swarajyalaxmi B
Bought by
Fan Hua Tzu and Wang Jui Chao
Purchase Details
Closed on
Apr 1, 2003
Sold by
Thandra Vijayalakshmi R and Thandra Vamshi
Bought by
Madadi Surendar Rao and Rao Swarajyalaxmi B
Home Financials for this Owner
Home Financials are based on the most recent Mortgage that was taken out on this home.
Original Mortgage
$96,000
Interest Rate
5.71%
Mortgage Type
Purchase Money Mortgage
Purchase Details
Closed on
Oct 26, 1999
Sold by
Bernice E Trust Hessler
Bought by
Thandra Vijayalakshmi R
Purchase Details
Closed on
Aug 14, 1997
Sold by
Tekchandani Anita H
Bought by
Hessler Robert J and Hessler Bernice E
Create a Home Valuation Report for This Property
The Home Valuation Report is an in-depth analysis detailing your home's value as well as a comparison with similar homes in the area
Home Values in the Area
Average Home Value in this Area
Purchase History
| Date | Buyer | Sale Price | Title Company |
|---|---|---|---|
| H T Fan Llc | -- | None Available | |
| Fan Hua Tzu | $142,000 | Transnation Title | |
| Madadi Surendar Rao | $120,000 | -- | |
| Thandra Vijayalakshmi R | $89,000 | -- | |
| Hessler Robert J | $71,000 | -- |
Source: Public Records
Mortgage History
| Date | Status | Borrower | Loan Amount |
|---|---|---|---|
| Previous Owner | Madadi Surendar Rao | $96,000 |
Source: Public Records
Tax History Compared to Growth
Tax History
| Year | Tax Paid | Tax Assessment Tax Assessment Total Assessment is a certain percentage of the fair market value that is determined by local assessors to be the total taxable value of land and additions on the property. | Land | Improvement |
|---|---|---|---|---|
| 2025 | $5,002 | $101,100 | $0 | $0 |
| 2024 | $4,865 | $99,900 | $0 | $0 |
| 2023 | $4,492 | $95,100 | $0 | $0 |
| 2022 | $5,437 | $84,400 | $0 | $0 |
| 2021 | $5,283 | $90,600 | $0 | $0 |
| 2020 | $5,117 | $85,500 | $0 | $0 |
| 2019 | $4,881 | $83,000 | $83,000 | $0 |
| 2018 | $4,789 | $77,100 | $0 | $0 |
| 2017 | $4,620 | $79,900 | $0 | $0 |
| 2016 | $4,501 | $72,751 | $0 | $0 |
| 2015 | $4,317 | $72,534 | $0 | $0 |
| 2014 | $4,317 | $70,268 | $0 | $0 |
| 2013 | -- | $70,268 | $0 | $0 |
Source: Public Records
Map
Nearby Homes
- 330 Detroit St Unit 201
- 330 Detroit St Unit 202
- 330 Detroit St Unit 301
- 330 Detroit St Unit 302
- 330 Detroit St Unit 501
- 330 Detroit St Unit 502
- 330 Detroit St Unit 304
- 330 Detroit St Unit 303
- 330 Detroit St Unit 402
- 330 Detroit St Unit 503
- 330 Detroit St Unit 101
- 330 Detroit St Unit 403
- 330 Detroit St Unit 401
- 330 Detroit St Unit 203
- 330 Detroit St Unit 204
- 922 Catherine St
- 530 N Division St Unit B
- 530 N Division St Unit A
- 530 N Division St Unit D
- 530 N Division St Unit C
- 813 E Kingsley St Unit C4
- 813 E Kingsley St Unit B4
- 813 E Kingsley St Unit C3
- 813 E Kingsley St Unit C1
- 813 E Kingsley St Unit C2
- 813 E Kingsley St Unit B2
- 813 E Kingsley St Unit A3
- 813 E Kingsley St Unit D3
- 813 E Kingsley St Unit A1
- 813 E Kingsley St Unit D2
- 813 E Kingsley St Unit D1
- 813 E Kingsley St Unit B3
- 813 E Kingsley St Unit B1
- 813 E Kingsley St Unit A2
- 813 E Kingsley St Unit 1
- 813 E Kingsley St
- 813 E Kingsley #D1 East Kingsley #D1
- 809 E Kingsley St
- 820 E Kingsley St Unit 1B
- 820 E Kingsley St Unit 3