
Seller's Agent in 2014
Ronald Duff
RE/MAX Professionals
(217) 652-6025
1 in this area
43 Total Sales

Estimated Value: $159,000 - $204,218
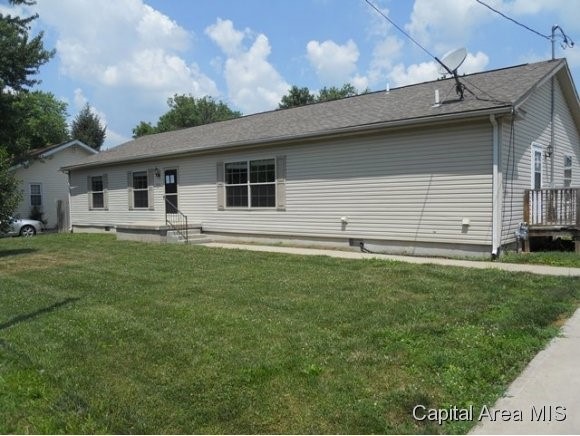
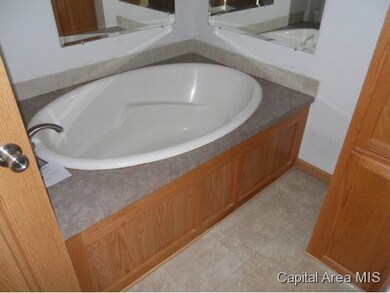
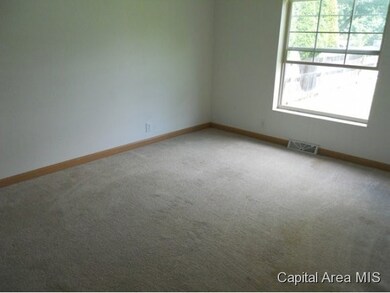
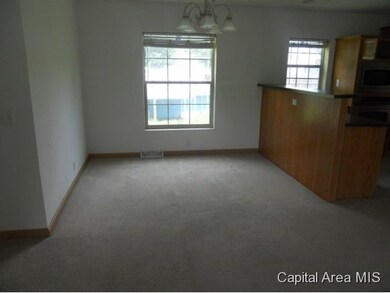
WOW.... WHAT A GREAT PRICE ON THIS NEWER HOME WITH OVER 2,000 SQ. FEET OF LIVING SPACE. SUPER NICE KITCHEN. FAMILY ROOM WITH FIREPLACE. MASTER BATH HAS WHIRLPOOL TUB. OVERSIZED DETACHED GARAGE. PROPERTY TO BE SOLD AS-IS, WHERE-IS. LOAN PRE-APPROVAL LETTER OR PROOF OF CASH FUNDS NEEDED WITH ALL OFFERS. EQUAL HOUSING OPPORTUNITY
Last Agent to Sell the Property
RE/MAX Professionals License #471001747 Listed on: 08/03/2013
| Date | Buyer | Sale Price | Title Company |
|---|---|---|---|
| Cook Phillip A | $35,000 | None Available | |
| Cook Lois | -- | Prairie Land Title Company | |
| Fifth Third Mortgage Co | -- | None Available |
| Date | Event | Price | List to Sale | Price per Sq Ft |
|---|---|---|---|---|
| 01/10/2014 01/10/14 | Sold | $60,000 | -40.0% | $29 / Sq Ft |
| 12/16/2013 12/16/13 | Pending | -- | -- | -- |
| 08/03/2013 08/03/13 | For Sale | $100,000 | -- | $49 / Sq Ft |
| Year | Tax Paid | Tax Assessment Tax Assessment Total Assessment is a certain percentage of the fair market value that is determined by local assessors to be the total taxable value of land and additions on the property. | Land | Improvement |
|---|---|---|---|---|
| 2024 | $2,825 | $46,605 | $4,667 | $41,938 |
| 2023 | $2,602 | $42,694 | $4,275 | $38,419 |
| 2022 | $2,458 | $39,649 | $3,970 | $35,679 |
| 2021 | $2,308 | $38,124 | $3,817 | $34,307 |
| 2020 | $1,841 | $27,785 | $3,883 | $23,902 |
| 2019 | $1,852 | $28,544 | $3,989 | $24,555 |
| 2018 | $1,785 | $27,357 | $3,823 | $23,534 |
| 2017 | $1,724 | $26,666 | $3,726 | $22,940 |
| 2016 | $1,292 | $20,580 | $6,589 | $13,991 |
| 2015 | $718 | $20,430 | $6,541 | $13,889 |
| 2014 | $922 | $20,000 | $6,403 | $13,597 |
| 2013 | $3,695 | $48,280 | $6,403 | $41,877 |
| 2011 | $3,172 | $48,200 | $6,273 | $41,927 |
Seller's Agent in 2014
Ronald Duff
RE/MAX Professionals
(217) 652-6025
1 in this area
43 Total Sales
Buyer's Agent in 2014
Steve Craggs
Craggs REALTORS, Inc.
(217) 823-9272
116 in this area
189 Total Sales
Source: RMLS Alliance
MLS Number: RMACA134310
APN: 17-13-23-303-009-00
Disclaimer: Certain information contained herein is derived from information provided by parties other than Homes.com. All information provided is deemed reliable, but is not guaranteed to be accurate and should be independently verified.
![]() Based on information submitted to the MLS GRID. All data is obtained from various sources and may not have been verified by broker or MLS GRID. Supplied Open House Information is subject to change without notice. All information should be independently reviewed and verified for accuracy. Properties may or may not be listed by the office/agent presenting the information. Some IDX listings have been excluded from this website.IDX information is provided exclusively for personal, non-commercial use, and may not be used for any purpose other than to identify prospective properties consumers may be interested in purchasing. Information is deemed reliable but not guaranteed.
Based on information submitted to the MLS GRID. All data is obtained from various sources and may not have been verified by broker or MLS GRID. Supplied Open House Information is subject to change without notice. All information should be independently reviewed and verified for accuracy. Properties may or may not be listed by the office/agent presenting the information. Some IDX listings have been excluded from this website.IDX information is provided exclusively for personal, non-commercial use, and may not be used for any purpose other than to identify prospective properties consumers may be interested in purchasing. Information is deemed reliable but not guaranteed.
Based on information submitted to the MLS GRID
Ask me questions while you tour the home.