Estimated Value: $170,000 - $177,867
3
Beds
1
Bath
1,294
Sq Ft
$134/Sq Ft
Est. Value
About This Home
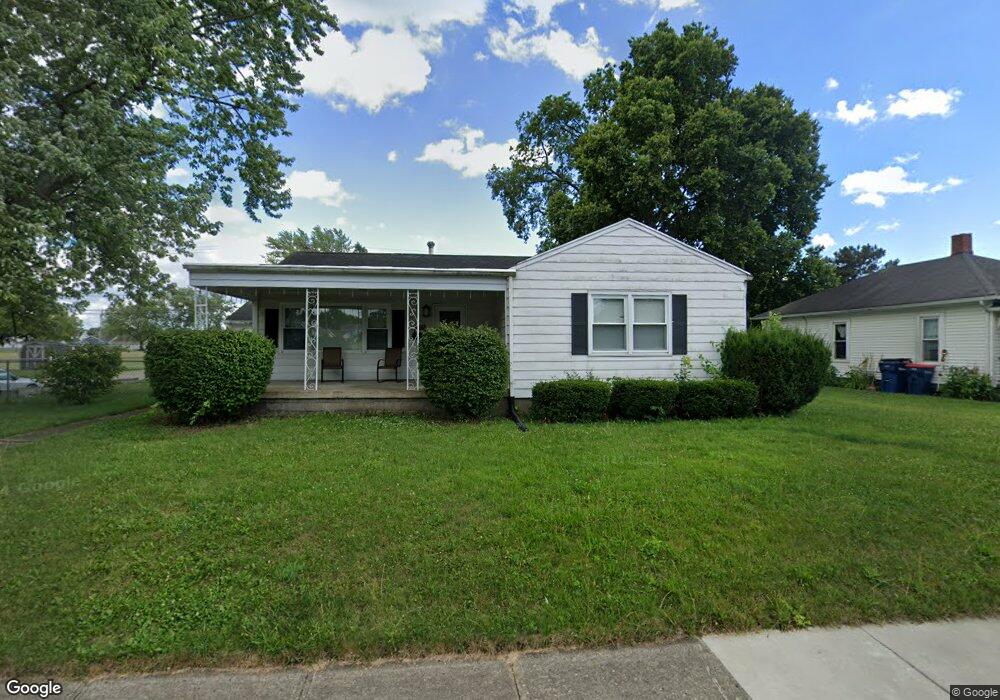
This home is located at 813 Elm St, Piqua, OH 45356 and is currently estimated at $173,967, approximately $134 per square foot. 813 Elm St is a home located in Miami County with nearby schools including Piqua Central Intermediate School, Springcreek Primary School, and Piqua Junior High School.
Ownership History
Date
Name
Owned For
Owner Type
Purchase Details
Closed on
Aug 15, 2018
Sold by
Miller Tara
Bought by
Mays Rosalie H
Current Estimated Value
Home Financials for this Owner
Home Financials are based on the most recent Mortgage that was taken out on this home.
Original Mortgage
$88,369
Outstanding Balance
$76,946
Interest Rate
4.62%
Mortgage Type
FHA
Estimated Equity
$97,021
Purchase Details
Closed on
Oct 30, 2017
Sold by
Us Bank Na
Bought by
Miller Tara
Purchase Details
Closed on
Oct 27, 2017
Sold by
Miller Tara
Bought by
Corle Clyde E and Corcle Patricia A
Purchase Details
Closed on
Aug 20, 2004
Sold by
Chambers Ruth V Ketzel
Bought by
Howk Patricia A
Purchase Details
Closed on
Jan 1, 1990
Bought by
Chambers Ruth V K
Create a Home Valuation Report for This Property
The Home Valuation Report is an in-depth analysis detailing your home's value as well as a comparison with similar homes in the area
Home Values in the Area
Average Home Value in this Area
Purchase History
| Date | Buyer | Sale Price | Title Company |
|---|---|---|---|
| Mays Rosalie H | $90,000 | None Available | |
| Miller Tara | $40,000 | -- | |
| Corle Clyde E | -- | -- | |
| Howk Patricia A | $107,000 | -- | |
| Chambers Ruth V K | -- | -- |
Source: Public Records
Mortgage History
| Date | Status | Borrower | Loan Amount |
|---|---|---|---|
| Open | Mays Rosalie H | $88,369 |
Source: Public Records
Tax History Compared to Growth
Tax History
| Year | Tax Paid | Tax Assessment Tax Assessment Total Assessment is a certain percentage of the fair market value that is determined by local assessors to be the total taxable value of land and additions on the property. | Land | Improvement |
|---|---|---|---|---|
| 2024 | $1,654 | $40,250 | $10,780 | $29,470 |
| 2023 | $1,654 | $40,250 | $10,780 | $29,470 |
| 2022 | $1,683 | $40,250 | $10,780 | $29,470 |
| 2021 | $1,416 | $30,980 | $8,300 | $22,680 |
| 2020 | $1,388 | $30,980 | $8,300 | $22,680 |
| 2019 | $1,395 | $30,980 | $8,300 | $22,680 |
| 2018 | $1,285 | $26,500 | $8,610 | $17,890 |
| 2017 | $1,266 | $26,500 | $8,610 | $17,890 |
| 2016 | $1,252 | $26,500 | $8,610 | $17,890 |
| 2015 | $1,232 | $25,490 | $8,300 | $17,190 |
| 2014 | $1,232 | $25,490 | $8,300 | $17,190 |
| 2013 | $1,236 | $25,490 | $8,300 | $17,190 |
Source: Public Records
Map
Nearby Homes