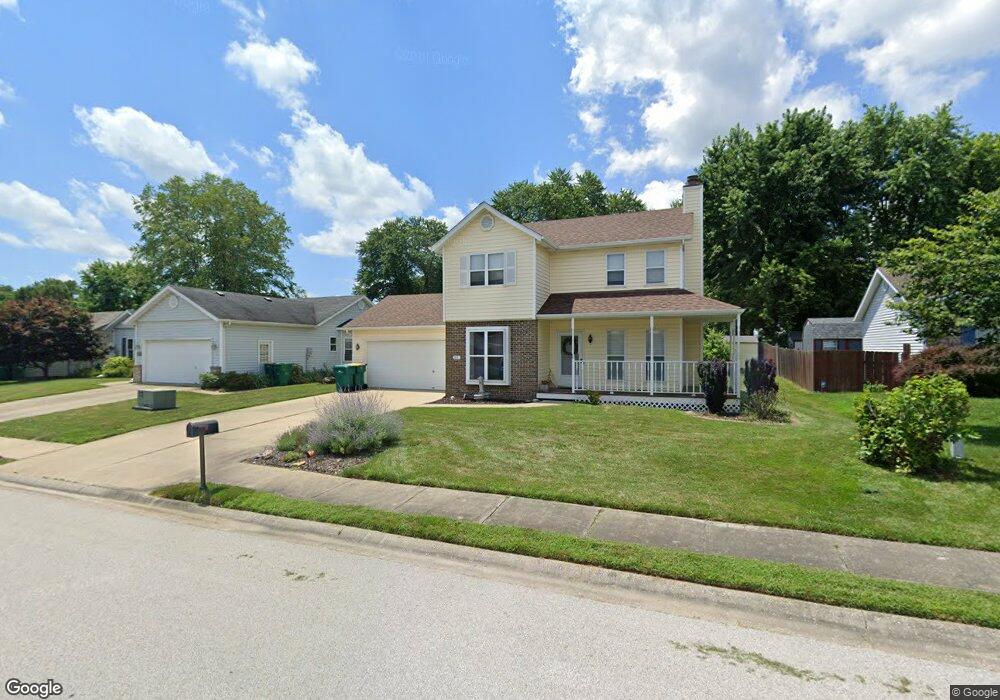
813 Emerald Green Dr O Fallon, IL 62269
Estimated Value: $229,000 - $272,000
3
Beds
3
Baths
1,460
Sq Ft
$171/Sq Ft
Est. Value
About This Home
This home is located at 813 Emerald Green Dr, O Fallon, IL 62269 and is currently estimated at $250,193, approximately $171 per square foot. 813 Emerald Green Dr is a home located in St. Clair County with nearby schools including Central Elementary School, Joseph Arthur Middle School, and O'Fallon Township High School.
Ownership History
Date
Name
Owned For
Owner Type
Purchase Details
Closed on
Nov 5, 2013
Sold by
Osborne William
Bought by
Revis Marsha and Marsha Revis Non Marital Land Trust
Current Estimated Value
Purchase Details
Closed on
Sep 6, 2013
Sold by
Jackson Matthew M and Jackson Crystal L
Bought by
Osborne William and William Osborne Revocable Living Trust
Purchase Details
Closed on
Apr 17, 2013
Sold by
Amos William D and Amos Linda D
Bought by
Jackson Matthew M and Jackson Crystal L
Home Financials for this Owner
Home Financials are based on the most recent Mortgage that was taken out on this home.
Original Mortgage
$132,050
Interest Rate
2.5%
Mortgage Type
New Conventional
Purchase Details
Closed on
May 28, 2004
Sold by
Ortiz Christopher and Ortiz Teresa M
Bought by
Amos William D and Amos Linda D
Home Financials for this Owner
Home Financials are based on the most recent Mortgage that was taken out on this home.
Original Mortgage
$117,000
Interest Rate
5.99%
Mortgage Type
Purchase Money Mortgage
Create a Home Valuation Report for This Property
The Home Valuation Report is an in-depth analysis detailing your home's value as well as a comparison with similar homes in the area
Home Values in the Area
Average Home Value in this Area
Purchase History
| Date | Buyer | Sale Price | Title Company |
|---|---|---|---|
| Revis Marsha | -- | Old Title & Escrow Svc Inc | |
| Osborne William | $152,000 | Old Title & Escrow Svcs Inc | |
| Jackson Matthew M | $139,000 | Pti | |
| Amos William D | $146,500 | Pti |
Source: Public Records
Mortgage History
| Date | Status | Borrower | Loan Amount |
|---|---|---|---|
| Previous Owner | Jackson Matthew M | $132,050 | |
| Previous Owner | Amos William D | $117,000 |
Source: Public Records
Tax History
| Year | Tax Paid | Tax Assessment Tax Assessment Total Assessment is a certain percentage of the fair market value that is determined by local assessors to be the total taxable value of land and additions on the property. | Land | Improvement |
|---|---|---|---|---|
| 2024 | $2,530 | $65,687 | $11,305 | $54,382 |
| 2023 | $2,726 | $58,120 | $10,003 | $48,117 |
| 2022 | $2,695 | $53,637 | $9,803 | $43,834 |
| 2021 | $2,798 | $50,908 | $9,304 | $41,604 |
| 2020 | $2,830 | $48,223 | $8,814 | $39,409 |
| 2019 | $2,887 | $48,223 | $8,814 | $39,409 |
| 2018 | $2,922 | $49,797 | $9,424 | $40,373 |
| 2017 | $2,969 | $47,777 | $9,042 | $38,735 |
| 2016 | $3,001 | $46,698 | $8,838 | $37,860 |
| 2014 | $3,345 | $47,411 | $10,455 | $36,956 |
| 2013 | $3,523 | $48,285 | $10,648 | $37,637 |
Source: Public Records
Map
Nearby Homes
- 1350 Terrace Green Ln
- 1009 Richland Park Dr
- 1016 Richland Park Dr
- 1439 Kingsley Dr
- 1301 Stone Hill Dr
- 1304 Three Rivers Dr Unit 5B
- 110 Famous Ave
- 509 Long Dr
- 205 Belt Ave
- 2244 Haverford Dr
- 643 Rain Hollow Dr
- 1214 Carleton Ln
- 2728 Lauren Lake Dr
- 124 Cottage Hill Dr
- 1232 Carleton Ln
- 195 Eagle Ridge Unit 195
- 2645 Katrine Lake Dr
- 215 Eagle Ridge Unit 215
- 164 Eagle Ridge
- 161 Eagle Ridge Unit 161
- 819 Emerald Green Dr
- 807 Emerald Green Dr
- 825 Emerald Green Dr
- 1307 Terrace Green Ln
- 812 Emerald Green Dr
- 1313 Terrace Green Ln
- 818 Emerald Green Dr
- 806 Emerald Green Dr
- 833 Emerald Green Dr
- 1319 Terrace Green Ln
- 800 Emerald Green Dr
- 1325 Terrace Green Ln
- 830 Emerald Green Dr
- 813 Kelley Dr
- 819 Kelley Dr
- 839 Emerald Green Dr
- 807 Kelley Dr
- 825 Kelley Dr
- 1331 Terrace Green Ln
- 1308 Terrace Green Ln
Your Personal Tour Guide
Ask me questions while you tour the home.