813 Fred Ash Rd Dahlonega, GA 30533
Estimated Value: $261,099 - $343,000
--
Bed
1
Bath
1,120
Sq Ft
$261/Sq Ft
Est. Value
About This Home
This home is located at 813 Fred Ash Rd, Dahlonega, GA 30533 and is currently estimated at $292,525, approximately $261 per square foot. 813 Fred Ash Rd is a home located in Lumpkin County with nearby schools including Clay County Middle School and Lumpkin County High School.
Ownership History
Date
Name
Owned For
Owner Type
Purchase Details
Closed on
Sep 12, 2014
Sold by
Fortner Wilburn
Bought by
Fortner Wilburn and Fortner Clint
Current Estimated Value
Purchase Details
Closed on
Jun 19, 2001
Sold by
Fortner Wilburn
Bought by
Fortner Wilburn and Fortner Josalin
Purchase Details
Closed on
Aug 28, 2000
Bought by
Fortner Wilburn
Purchase Details
Closed on
Mar 13, 1991
Sold by
Fortner Wilburn
Bought by
Fortner Wilburn
Create a Home Valuation Report for This Property
The Home Valuation Report is an in-depth analysis detailing your home's value as well as a comparison with similar homes in the area
Home Values in the Area
Average Home Value in this Area
Purchase History
| Date | Buyer | Sale Price | Title Company |
|---|---|---|---|
| Fortner Wilburn | -- | -- | |
| Fortner Wilburn | -- | -- | |
| Fortner Wilburn | -- | -- | |
| Fortner Wilburn | -- | -- |
Source: Public Records
Tax History Compared to Growth
Tax History
| Year | Tax Paid | Tax Assessment Tax Assessment Total Assessment is a certain percentage of the fair market value that is determined by local assessors to be the total taxable value of land and additions on the property. | Land | Improvement |
|---|---|---|---|---|
| 2024 | $4 | $68,508 | $14,510 | $53,998 |
| 2023 | $0 | $63,724 | $13,560 | $50,164 |
| 2022 | $1,294 | $52,252 | $11,298 | $40,954 |
| 2021 | $1,282 | $45,186 | $11,298 | $33,888 |
| 2020 | $1,240 | $43,704 | $10,824 | $32,880 |
| 2019 | $1,240 | $43,704 | $10,824 | $32,880 |
| 2018 | $1,141 | $40,202 | $10,824 | $29,378 |
| 2017 | $0 | $38,194 | $10,824 | $27,370 |
| 2016 | -- | $34,638 | $10,824 | $23,814 |
| 2015 | -- | $34,639 | $10,824 | $23,814 |
| 2014 | -- | $34,869 | $10,824 | $24,045 |
| 2013 | -- | $35,722 | $10,824 | $24,898 |
Source: Public Records
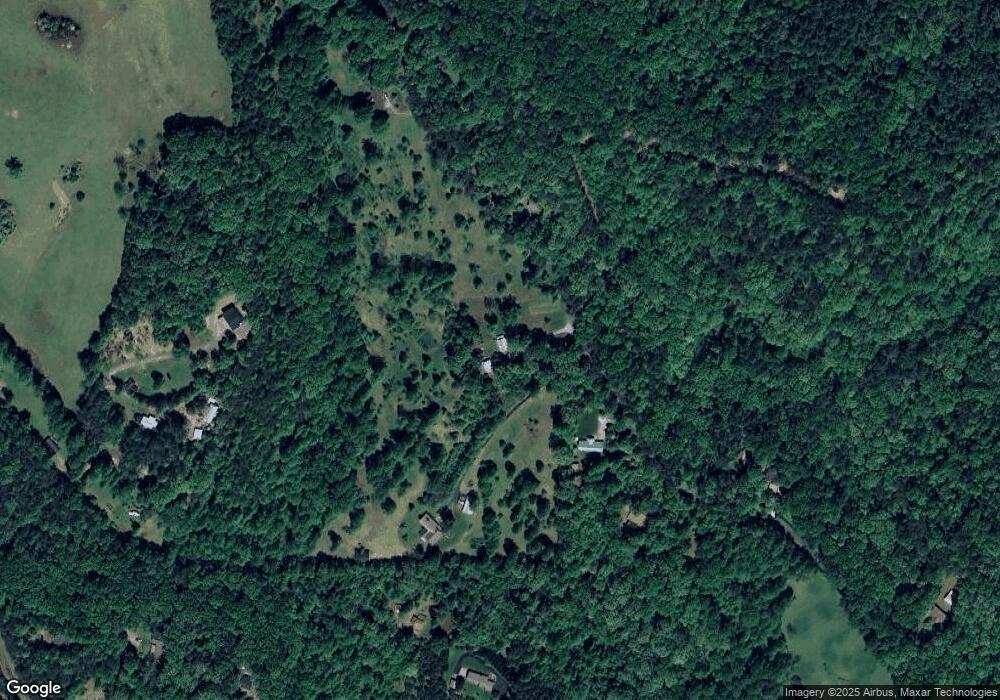
Map
Nearby Homes
- 924 Fred Ash Rd
- 1556 Syrup Mill Rd
- 00 Woodland Ln
- 98 Elbert Gaddis Rd
- 96 Elbert Gaddis Rd
- Lot 5 Sweet Apple Ln
- 1879 Camp Wahsega Rd
- 26 Dowdy Ct
- 239 Glenn Elliott Rd
- LOT 1 the Overlook at Crown Mountain
- Tr 3 Glenn Elliot Rd
- 434 Emerald Ridge
- 955 Camp Wahsega Rd
- 22 Deer Ridge Rd
- 122 Tritt Rd
- 7709 Highway 19 N
- 0 Ridley Rd Unit 7672007
- 0 Ridley Rd Unit 10632021
- 0 Yahoola Ridge Unit 10624699
- 0 Yahoola Ridge Unit 7665701
- 745 Fred Ash Rd
- 795 Fred Ash Rd
- 673 Fred Ash Rd
- 1038 Fred Ash Rd
- 979 Fred Ash Rd
- 620 Fred Ash Rd
- 348 Walter Ash Rd
- 1712 Duffy Grizzle Rd
- 320 Walter Ash Rd
- 243 Walter Ash Rd
- 1916 Duffy Grizzle Rd
- 1710 Duffy Grizzle Rd
- 78 Bo Dig Cir
- 1874 Duffy Grizzle Rd
- 211 Walter Ash Rd
- 409 Fred Ash Rd
- 1858 Duffy Grizzle Rd
- 1926 Duffy Grizzle Rd
- 1926 Duffy Grizzle Rd Unit 1
- 502 Fred Ash Rd