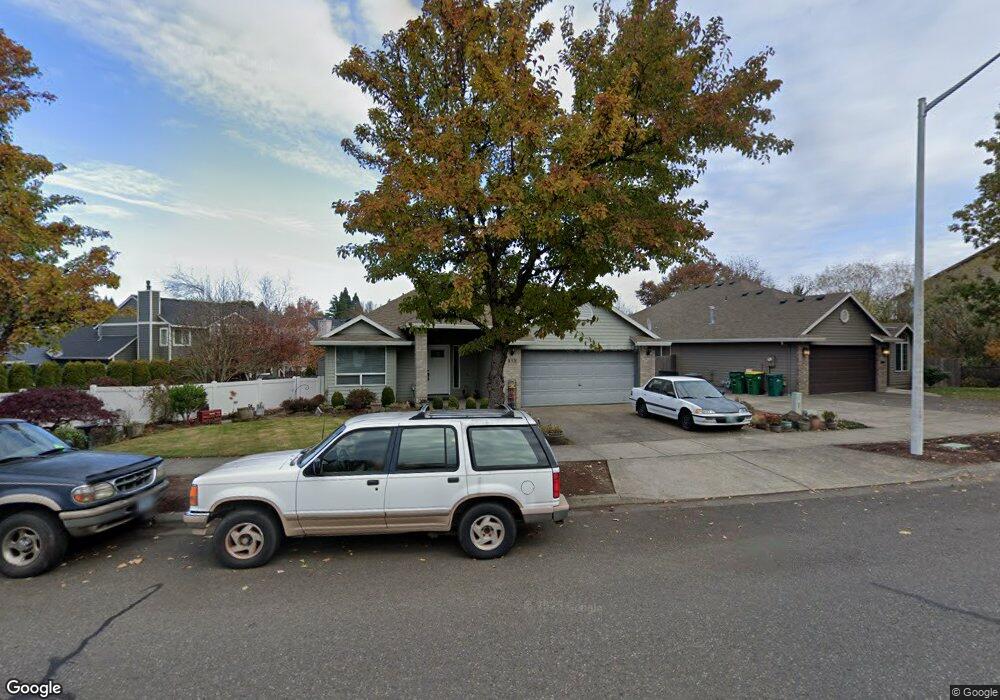
813 Goff Rd Forest Grove, OR 97116
Estimated Value: $489,605 - $539,000
3
Beds
2
Baths
1,710
Sq Ft
$301/Sq Ft
Est. Value
About This Home
This home is located at 813 Goff Rd, Forest Grove, OR 97116 and is currently estimated at $514,151, approximately $300 per square foot. 813 Goff Rd is a home located in Washington County with nearby schools including Dilley Elementary School, Tom McCall Upper Elementary School, and Neil Armstrong Middle School.
Ownership History
Date
Name
Owned For
Owner Type
Purchase Details
Closed on
Aug 15, 2018
Sold by
Flett Patricia Anne
Bought by
Flett Patricia Anne and The Patricia Ane Flett Revocab
Current Estimated Value
Purchase Details
Closed on
Jul 30, 2007
Sold by
Carty Matthew M and Carty Kimi R
Bought by
Flett John H and Flett Patricia A
Home Financials for this Owner
Home Financials are based on the most recent Mortgage that was taken out on this home.
Original Mortgage
$67,900
Outstanding Balance
$42,594
Interest Rate
6.66%
Mortgage Type
Unknown
Estimated Equity
$471,557
Purchase Details
Closed on
Sep 9, 2005
Sold by
Carty Matthew M
Bought by
Carty Kimi R
Purchase Details
Closed on
Jun 21, 2001
Sold by
Glenn Schroeder Construction Inc
Bought by
Carty Matthew M
Home Financials for this Owner
Home Financials are based on the most recent Mortgage that was taken out on this home.
Original Mortgage
$177,443
Interest Rate
7.15%
Mortgage Type
FHA
Create a Home Valuation Report for This Property
The Home Valuation Report is an in-depth analysis detailing your home's value as well as a comparison with similar homes in the area
Purchase History
| Date | Buyer | Sale Price | Title Company |
|---|---|---|---|
| Flett Patricia Anne | -- | None Available | |
| Flett John H | $299,900 | Fidelity Natl Title Co Of Or | |
| Carty Kimi R | -- | -- | |
| Carty Matthew M | $179,950 | First American |
Source: Public Records
Mortgage History
| Date | Status | Borrower | Loan Amount |
|---|---|---|---|
| Open | Flett John H | $67,900 | |
| Previous Owner | Carty Matthew M | $177,443 |
Source: Public Records
Tax History
| Year | Tax Paid | Tax Assessment Tax Assessment Total Assessment is a certain percentage of the fair market value that is determined by local assessors to be the total taxable value of land and additions on the property. | Land | Improvement |
|---|---|---|---|---|
| 2026 | $4,787 | $268,840 | -- | -- |
| 2025 | $4,787 | $261,010 | -- | -- |
| 2024 | $4,618 | $253,410 | -- | -- |
| 2023 | $4,618 | $246,030 | $0 | $0 |
| 2022 | $4,038 | $246,030 | $0 | $0 |
| 2021 | $3,986 | $231,920 | $0 | $0 |
| 2020 | $3,965 | $225,170 | $0 | $0 |
| 2019 | $3,876 | $218,620 | $0 | $0 |
| 2018 | $3,758 | $212,260 | $0 | $0 |
| 2017 | $3,641 | $206,080 | $0 | $0 |
| 2016 | $3,539 | $200,080 | $0 | $0 |
| 2015 | $3,403 | $194,260 | $0 | $0 |
| 2014 | $3,387 | $188,610 | $0 | $0 |
Source: Public Records
Map
Nearby Homes
- 1030 Willamina Ave
- 2440 Heather Way
- 2545 Windstream St
- 1315 Begonia Ave
- 1310 Gales Creek Rd
- 916 Rosebud Ct
- 904 Rosebud Ct
- 918 Rosebud Ct
- 920 Rosebud Ct
- 922 Rosebud Ct
- 911 Rosebud Ct
- 901 Rosebud Ct
- 836 Misty Ln
- 3245 Butte Dr
- 819 Misty Ln
- 1820 NW Thatcher Rd
- 811 Misty Ln
- 1407 Willamina Ave
- 3305 Butte Dr
- 801 Misty Ln
- 819 Goff Rd
- 816 Willamina Ave
- 810 Willamina Ave
- 822 Willamina Ave
- 802 Goff Rd
- 2615 Forge Dr
- 828 Willamina Ave
- 933 Goff Rd
- 2614 Forge Dr
- 922 Goff Rd
- 2611 Forge Dr
- 932 Willamina Ave
- 815 Willamina Ave
- 2619 Strasburg Dr
- 945 Goff Rd
- 934 Goff Rd
- 2610 Forge Dr
- 2609 Strasburg Dr
- 2519 Forge Dr
- 2703 Knox Ridge Terrace
Your Personal Tour Guide
Ask me questions while you tour the home.