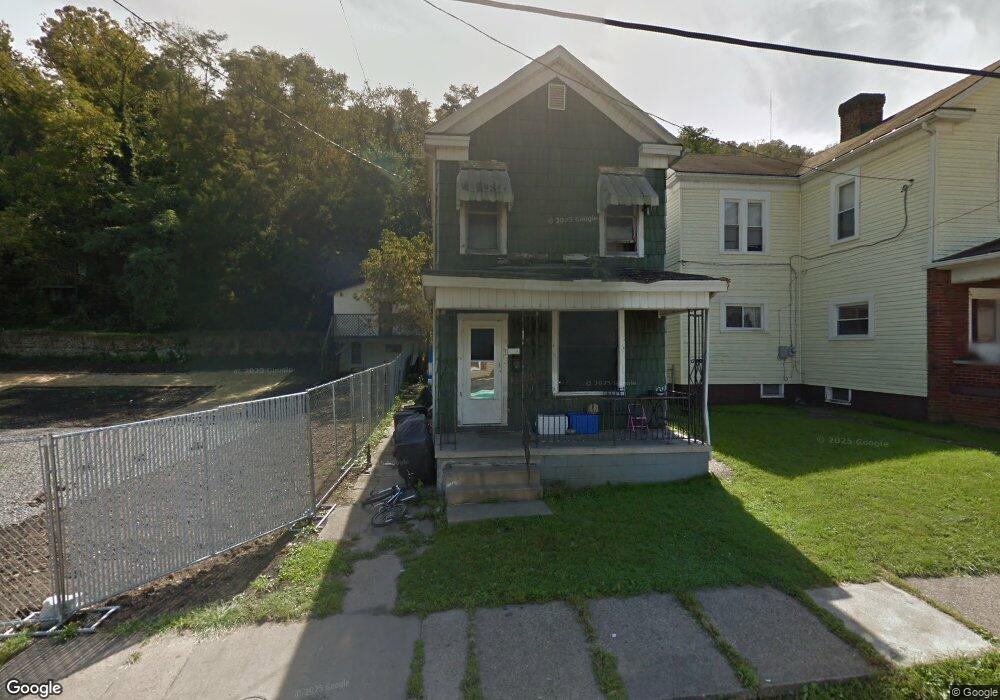
813 Howard St Bridgeport, OH 43912
Estimated Value: $36,000 - $56,000
2
Beds
1
Bath
1,276
Sq Ft
$36/Sq Ft
Est. Value
About This Home
This home is located at 813 Howard St, Bridgeport, OH 43912 and is currently estimated at $46,000, approximately $36 per square foot. 813 Howard St is a home located in Belmont County with nearby schools including Bridgeport Elementary School, Bridgeport Middle School, and Bridgeport High School.
Ownership History
Date
Name
Owned For
Owner Type
Purchase Details
Closed on
Aug 1, 2024
Sold by
Coyne Brandon
Bought by
Sulken Enterprises Llc
Current Estimated Value
Purchase Details
Closed on
Mar 20, 2024
Sold by
Fahey Judith A
Bought by
Coyne Brandon
Purchase Details
Closed on
Jul 8, 2021
Sold by
Harris George L
Bought by
Fahey Judith
Purchase Details
Closed on
Mar 16, 2016
Sold by
Rare Properties Inc
Bought by
Harris George L
Purchase Details
Closed on
Jul 7, 1999
Bought by
Rare Properties Inc
Purchase Details
Closed on
Jun 23, 1999
Sold by
Cappella Philip and Cappella Tammy
Bought by
Cappella Philip and Cappella Tammy
Purchase Details
Closed on
Apr 28, 1994
Sold by
Baker Wilbur F and Baker Jane
Bought by
Baker Wilbur F and Baker Jane
Purchase Details
Closed on
Jan 1, 1986
Sold by
Subasic Paul A and Subasic Sharon
Bought by
Subasic Paul A and Subasic Sharon
Create a Home Valuation Report for This Property
The Home Valuation Report is an in-depth analysis detailing your home's value as well as a comparison with similar homes in the area
Home Values in the Area
Average Home Value in this Area
Purchase History
| Date | Buyer | Sale Price | Title Company |
|---|---|---|---|
| Sulken Enterprises Llc | -- | None Listed On Document | |
| Coyne Brandon | $66,666 | None Listed On Document | |
| Coyne Brandon | $66,666 | None Listed On Document | |
| Fahey Judith | -- | None Available | |
| Harris George L | $30,100 | Attorney | |
| Rare Properties Inc | $24,000 | -- | |
| Cappella Philip | -- | -- | |
| Baker Wilbur F | $22,000 | -- | |
| Subasic Paul A | -- | -- |
Source: Public Records
Tax History Compared to Growth
Tax History
| Year | Tax Paid | Tax Assessment Tax Assessment Total Assessment is a certain percentage of the fair market value that is determined by local assessors to be the total taxable value of land and additions on the property. | Land | Improvement |
|---|---|---|---|---|
| 2024 | $42 | $960 | $960 | -- |
| 2023 | $47 | $960 | $960 | $0 |
| 2022 | $44 | $962 | $962 | $0 |
| 2021 | $474 | $10,744 | $962 | $9,782 |
| 2020 | $1,152 | $8,950 | $800 | $8,150 |
| 2019 | $575 | $8,950 | $800 | $8,150 |
| 2018 | $1,422 | $8,950 | $800 | $8,150 |
| 2017 | $338 | $7,020 | $1,070 | $5,950 |
| 2016 | $591 | $7,020 | $1,070 | $5,950 |
| 2015 | $341 | $7,020 | $1,070 | $5,950 |
| 2014 | $402 | $7,970 | $970 | $7,000 |
| 2013 | $364 | $7,970 | $970 | $7,000 |
Source: Public Records
Map
Nearby Homes
- 1049 Buckeye St
- 8 Spring St
- 866 Main St
- 67478 Kirkwood Heights Rd
- 20 Locust Ave
- 61 Laipple St
- 902 National Rd
- 16 Patterson Rd
- 67620 Kirkwood Heights Rd
- 67730 Kirkwood Heights Rd
- 67605 Kirkwood Heights Rd
- 56624 Boyd Ave
- 0 Ohio 7
- 116 Ohio St
- 56316 National Rd
- 56559 Boyd Ave
- 219 S York St
- 217 N Huron St
- 50 Kentucky St
- 301 N Huron St