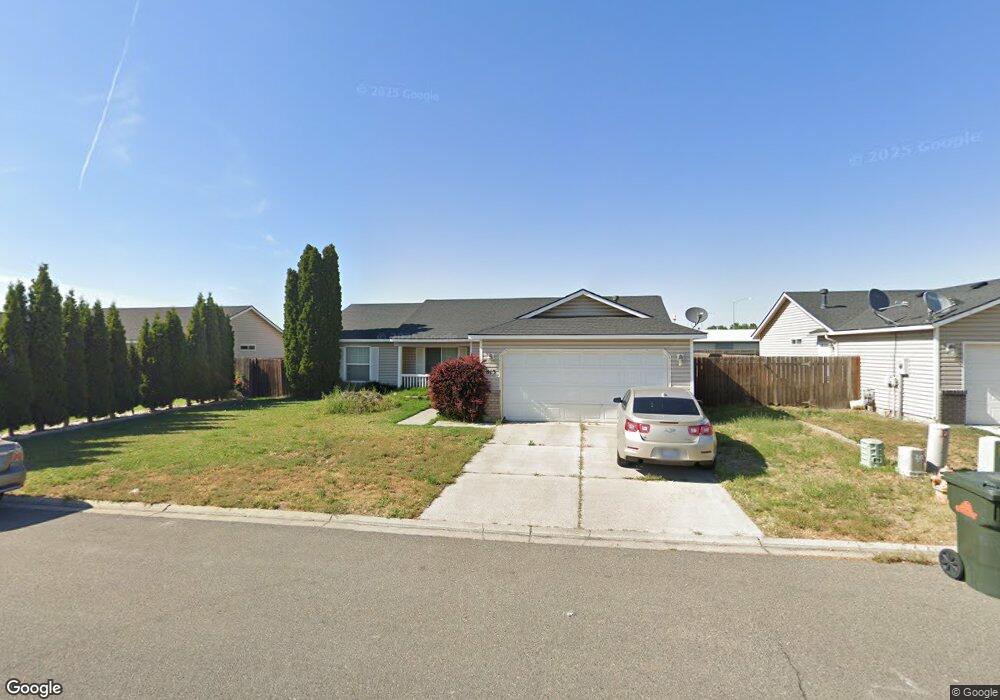
813 Jessica Ct Grandview, WA 98930
Estimated Value: $275,000 - $342,000
3
Beds
2
Baths
1,117
Sq Ft
$278/Sq Ft
Est. Value
About This Home
This home is located at 813 Jessica Ct, Grandview, WA 98930 and is currently estimated at $310,412, approximately $277 per square foot. 813 Jessica Ct is a home located in Yakima County with nearby schools including Grandview High School and Grandview Seventh-day Adventist School.
Ownership History
Date
Name
Owned For
Owner Type
Purchase Details
Closed on
Dec 15, 2005
Sold by
Regis Jacqueline
Bought by
Regis Gaspar
Current Estimated Value
Home Financials for this Owner
Home Financials are based on the most recent Mortgage that was taken out on this home.
Original Mortgage
$109,000
Interest Rate
6.31%
Mortgage Type
Fannie Mae Freddie Mac
Purchase Details
Closed on
Oct 27, 2005
Sold by
Soundbuilt Homes Inc
Bought by
Regis Gaspar
Home Financials for this Owner
Home Financials are based on the most recent Mortgage that was taken out on this home.
Original Mortgage
$109,000
Interest Rate
6.31%
Mortgage Type
Fannie Mae Freddie Mac
Purchase Details
Closed on
Sep 2, 2005
Sold by
Johnson Michael R
Bought by
Soundbuilt Homes Inc
Home Financials for this Owner
Home Financials are based on the most recent Mortgage that was taken out on this home.
Original Mortgage
$109,000
Interest Rate
6.31%
Mortgage Type
Fannie Mae Freddie Mac
Create a Home Valuation Report for This Property
The Home Valuation Report is an in-depth analysis detailing your home's value as well as a comparison with similar homes in the area
Home Values in the Area
Average Home Value in this Area
Purchase History
| Date | Buyer | Sale Price | Title Company |
|---|---|---|---|
| Regis Gaspar | -- | Pacific Alliance Title Co | |
| Regis Gaspar | $108,900 | Pacific Alliance Title Co | |
| Soundbuilt Homes Inc | $462,000 | Pacific Alliance Title Co |
Source: Public Records
Mortgage History
| Date | Status | Borrower | Loan Amount |
|---|---|---|---|
| Previous Owner | Regis Gaspar | $109,000 |
Source: Public Records
Tax History Compared to Growth
Tax History
| Year | Tax Paid | Tax Assessment Tax Assessment Total Assessment is a certain percentage of the fair market value that is determined by local assessors to be the total taxable value of land and additions on the property. | Land | Improvement |
|---|---|---|---|---|
| 2025 | $2,694 | $303,900 | $48,200 | $255,700 |
| 2023 | $2,825 | $250,900 | $39,000 | $211,900 |
| 2022 | $2,235 | $196,900 | $30,300 | $166,600 |
| 2021 | $2,189 | $177,500 | $27,200 | $150,300 |
| 2019 | $1,979 | $158,200 | $24,700 | $133,500 |
| 2018 | $1,674 | $118,200 | $22,300 | $95,900 |
| 2017 | $1,417 | $111,700 | $22,300 | $89,400 |
| 2016 | $1,270 | $110,450 | $22,250 | $88,200 |
| 2015 | $1,270 | $99,450 | $22,250 | $77,200 |
| 2014 | $1,270 | $100,450 | $22,250 | $78,200 |
| 2013 | $1,270 | $100,450 | $22,250 | $78,200 |
Source: Public Records
Map
Nearby Homes
- Lot 1A Vista Grande Way Unit Lt 1A
- 309 Douglas St
- 0 Olmstead Rd
- 614 E Wine Country Rd
- 423 E Wine Country Rd
- 402 Amberly Ave
- 503 Grandridge Rd
- 303 N Avenue B
- 400 W 5th St Unit 73
- 104 Luli St
- 108 Luli St
- 100 Luli St
- NKA W King St Lot A
- NKA W King St Lot B
- TBD Apricot Rd
- NKA Puterbaugh Rd
- NKA Apricot Rd
- 1509 Diamond
- Grandview Plan at Grandridge Estates
- Vashon Plan at Grandridge Estates
- 811 Jessica Ct
- 815 Jessica Ct
- 809 Jessica Ct
- 817 Jessica Ct
- Vista Grande #3 Grandview Unit Lot 3
- 812 Jessica Ct
- 810 Jessica Ct
- 814 Jessica Ct
- 808 Jessica Ct
- 807 Jessica Ct
- 819 Jessica Ct
- 806 Jessica Ct
- 816 Jessica Ct
- 820 Jessica Ct
- 813 Esperanza Way
- 811 Esperanza Way
- 815 Esperanza Way
- 805 Jessica Ct
- 818 Jessica Ct
- 809 Esperanza Way