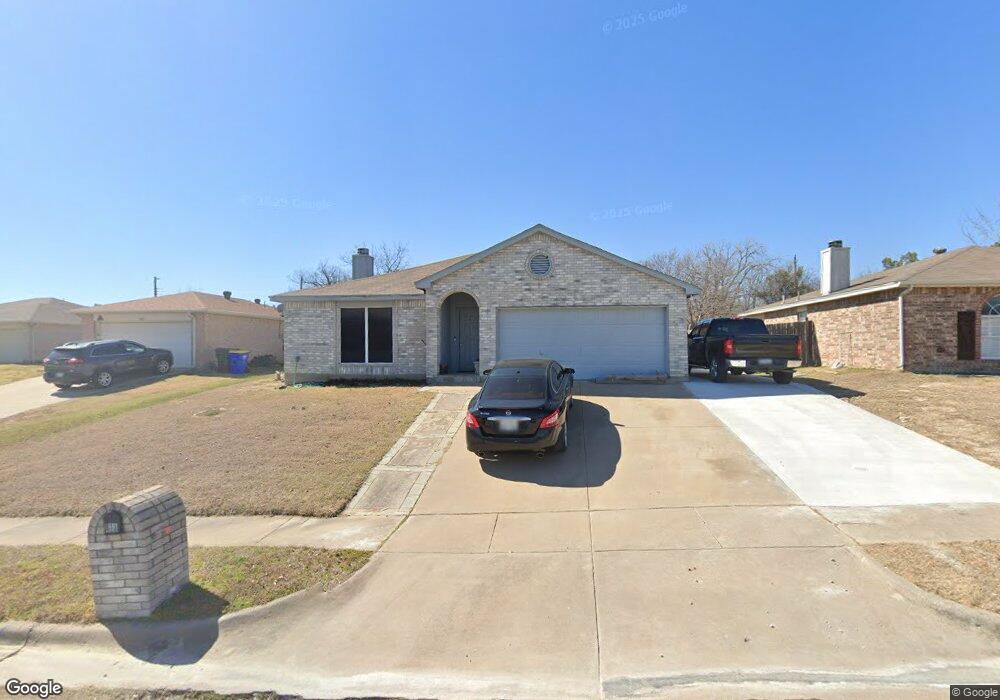
813 Mccully St Fort Worth, TX 76108
Estimated Value: $275,000 - $286,000
3
Beds
2
Baths
1,442
Sq Ft
$195/Sq Ft
Est. Value
About This Home
This home is located at 813 Mccully St, Fort Worth, TX 76108 and is currently estimated at $280,706, approximately $194 per square foot. 813 Mccully St is a home located in Tarrant County with nearby schools including North Elementary School, Brewer Middle School, and Tannahill Intermediate School.
Ownership History
Date
Name
Owned For
Owner Type
Purchase Details
Closed on
Sep 25, 2015
Sold by
Jaquez Angela Michelle
Bought by
Jaquez Jesus
Current Estimated Value
Purchase Details
Closed on
Dec 1, 1999
Sold by
Optima Builders Inc
Bought by
Jaquez Jesus and Jaquez Angela Michelle
Home Financials for this Owner
Home Financials are based on the most recent Mortgage that was taken out on this home.
Original Mortgage
$85,840
Outstanding Balance
$27,054
Interest Rate
7.95%
Mortgage Type
FHA
Estimated Equity
$253,652
Purchase Details
Closed on
Jun 22, 1999
Sold by
Lake Hollow Corp
Bought by
Optima Builders Inc
Home Financials for this Owner
Home Financials are based on the most recent Mortgage that was taken out on this home.
Original Mortgage
$80,000
Interest Rate
7.95%
Mortgage Type
Seller Take Back
Create a Home Valuation Report for This Property
The Home Valuation Report is an in-depth analysis detailing your home's value as well as a comparison with similar homes in the area
Home Values in the Area
Average Home Value in this Area
Purchase History
| Date | Buyer | Sale Price | Title Company |
|---|---|---|---|
| Jaquez Jesus | -- | Allegiance Title Company | |
| Jaquez Jesus | -- | Alamo Title Company | |
| Optima Builders Inc | -- | Alamo Title Company |
Source: Public Records
Mortgage History
| Date | Status | Borrower | Loan Amount |
|---|---|---|---|
| Open | Jaquez Jesus | $85,840 | |
| Previous Owner | Optima Builders Inc | $80,000 |
Source: Public Records
Tax History Compared to Growth
Tax History
| Year | Tax Paid | Tax Assessment Tax Assessment Total Assessment is a certain percentage of the fair market value that is determined by local assessors to be the total taxable value of land and additions on the property. | Land | Improvement |
|---|---|---|---|---|
| 2025 | $3,698 | $279,918 | $50,019 | $229,899 |
| 2024 | $3,698 | $279,918 | $50,019 | $229,899 |
| 2023 | $4,916 | $278,001 | $50,019 | $227,982 |
| 2022 | $5,091 | $227,357 | $25,000 | $202,357 |
| 2021 | $4,701 | $203,775 | $25,000 | $178,775 |
| 2020 | $4,305 | $189,211 | $25,000 | $164,211 |
| 2019 | $4,063 | $189,999 | $25,000 | $164,999 |
| 2018 | $3,118 | $128,388 | $11,000 | $117,388 |
| 2017 | $3,411 | $116,716 | $11,000 | $105,716 |
| 2016 | $3,469 | $126,348 | $11,000 | $115,348 |
| 2015 | $2,719 | $107,900 | $11,000 | $96,900 |
| 2014 | $2,719 | $107,900 | $11,000 | $96,900 |
Source: Public Records
Map
Nearby Homes
- 857 Mccully St
- 8113 Foxfire Ln
- 8133 Foxfire Ln
- 633 Lariat Ln
- 914 Ronald St
- 813 Hackamore St
- 8417 Omaha Dr
- 8401 Clifford St
- 8814 Rockway St
- 311 Russell St
- 8257 Killdeer Cir
- 8113 Raymond Ave
- 627 Hallvale Dr
- 200 Waynell St
- 1800 N Las Vegas Trail
- 8321 Raymond Ave
- 410 N Cherry Ln
- 9752 New Bern Dr
- 8811 Silver Creek Rd
- 304 Lockwood St