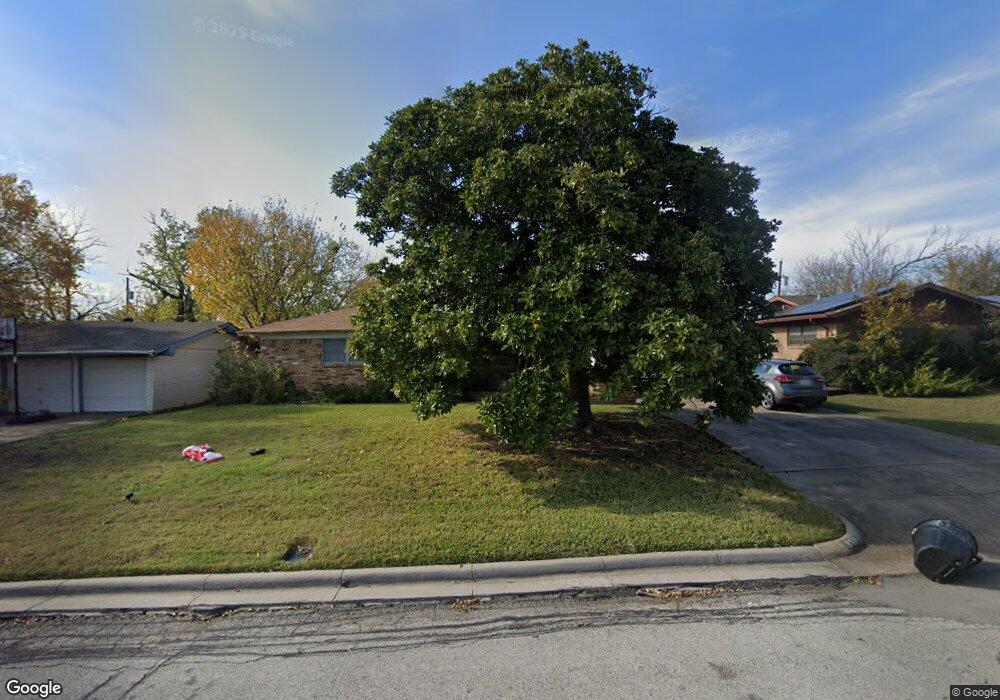
813 Mccurry Ave Bedford, TX 76022
Estimated Value: $309,476 - $335,000
3
Beds
2
Baths
1,620
Sq Ft
$201/Sq Ft
Est. Value
About This Home
This home is located at 813 Mccurry Ave, Bedford, TX 76022 and is currently estimated at $326,369, approximately $201 per square foot. 813 Mccurry Ave is a home located in Tarrant County with nearby schools including Bell Manor Elementary School, Central J High School, and Trinity High School.
Ownership History
Date
Name
Owned For
Owner Type
Purchase Details
Closed on
Feb 4, 2014
Sold by
Mebus Carolyn Ann and Davis Betty Jo
Bought by
Jones Michelle
Current Estimated Value
Create a Home Valuation Report for This Property
The Home Valuation Report is an in-depth analysis detailing your home's value as well as a comparison with similar homes in the area
Home Values in the Area
Average Home Value in this Area
Purchase History
| Date | Buyer | Sale Price | Title Company |
|---|---|---|---|
| Jones Michelle | -- | Rtc |
Source: Public Records
Tax History Compared to Growth
Tax History
| Year | Tax Paid | Tax Assessment Tax Assessment Total Assessment is a certain percentage of the fair market value that is determined by local assessors to be the total taxable value of land and additions on the property. | Land | Improvement |
|---|---|---|---|---|
| 2025 | $5,372 | $257,231 | $65,000 | $192,231 |
| 2024 | $5,179 | $275,933 | $65,000 | $210,933 |
| 2023 | $5,179 | $270,000 | $45,000 | $225,000 |
| 2022 | $4,956 | $226,921 | $45,000 | $181,921 |
| 2021 | $4,930 | $209,281 | $45,000 | $164,281 |
| 2020 | $4,365 | $183,584 | $45,000 | $138,584 |
| 2019 | $4,301 | $177,047 | $45,000 | $132,047 |
| 2018 | $3,629 | $149,384 | $25,000 | $124,384 |
| 2017 | $3,382 | $139,799 | $25,000 | $114,799 |
| 2016 | $3,241 | $133,976 | $25,000 | $108,976 |
| 2015 | $2,546 | $101,400 | $18,000 | $83,400 |
| 2014 | $2,546 | $101,400 | $18,000 | $83,400 |
Source: Public Records
Map
Nearby Homes
- 808 Gregory Ave
- 828 Gregory Ave
- 800 Prestwick St
- 2101 Gettysburg Place
- 2024 Charleston Dr
- 804 Natchez Ave
- 1216 Princeton Place
- 952 Charleston Dr
- 1049 Stableway Ln
- 2420 Dalewood Ln
- 933 Charleston Ct
- 2620 Britany Cir
- 1613 Trinity Ct
- 1116 Highpoint Rd
- 1604 Richmond Dr
- 1213 Greendale Dr
- 2201 Greendale Ct
- 2428 Chestnut Way
- 2025 Schumac Ln
- 2421 Creek Villas Dr
- 809 Mccurry Ave
- 817 Mccurry Ave
- 812 Central Dr
- 821 Mccurry Ave
- 816 Central Dr
- 808 Central Dr
- 812 Mccurry Ave
- 820 Central Dr
- 808 Mccurry Ave
- 816 Mccurry Ave
- 825 Mccurry Ave
- 804 Mccurry Ave
- 820 Mccurry Ave
- 824 Central Dr
- 800 Mccurry Ave
- 829 Mccurry Ave
- 824 Mccurry Ave
- 462 the Oaks Apartment
- 828 Central Dr
- 813 Gregory Ave