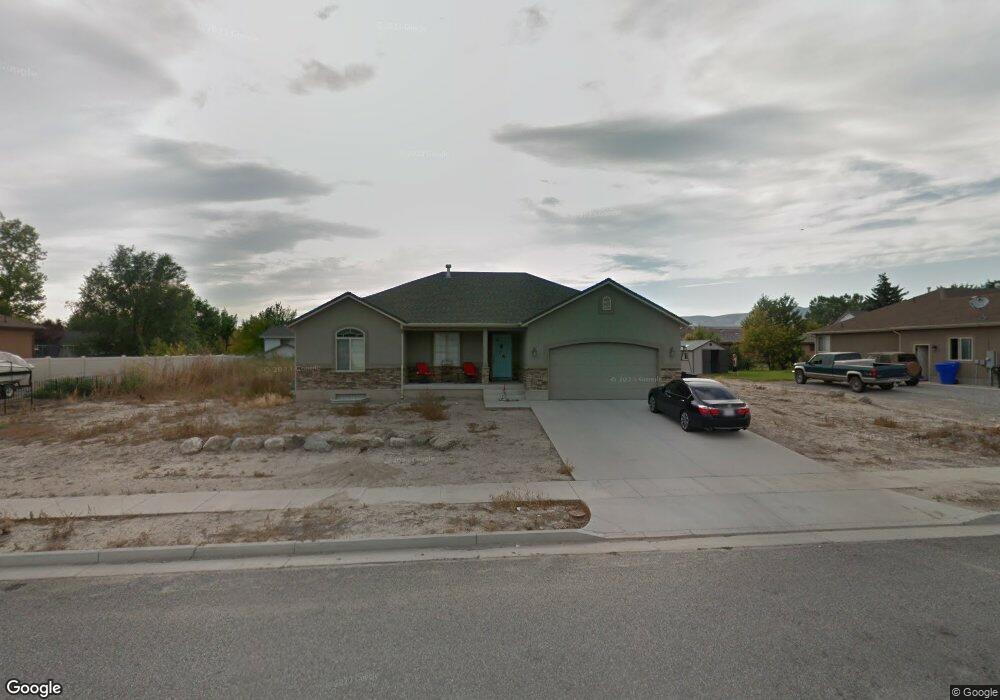
813 N 400 E Tremonton, UT 84337
Estimated Value: $470,000 - $510,000
Studio
--
Bath
1,581
Sq Ft
$312/Sq Ft
Est. Value
About This Home
This home is located at 813 N 400 E, Tremonton, UT 84337 and is currently estimated at $492,879, approximately $311 per square foot. 813 N 400 E is a home located in Box Elder County with nearby schools including North Park School, Bear River Middle School, and Alice C. Harris Intermediate School.
Ownership History
Date
Name
Owned For
Owner Type
Purchase Details
Closed on
Mar 11, 2009
Sold by
Callister Carson Rodger and Callister Courtney Dawn
Bought by
Callister Carson Rodger and Callister Courtney Daun
Current Estimated Value
Purchase Details
Closed on
Jun 11, 2007
Sold by
Majestic Construction & Development Inc
Bought by
Callister Carson Rodger and Callister Courtney Dawn
Home Financials for this Owner
Home Financials are based on the most recent Mortgage that was taken out on this home.
Original Mortgage
$190,066
Outstanding Balance
$115,985
Interest Rate
6.14%
Mortgage Type
FHA
Estimated Equity
$376,894
Purchase Details
Closed on
Feb 20, 2007
Sold by
Holmgren Investment Co Inc
Bought by
Majestic Construction & Development Inc
Home Financials for this Owner
Home Financials are based on the most recent Mortgage that was taken out on this home.
Original Mortgage
$36,000
Interest Rate
6.21%
Mortgage Type
Purchase Money Mortgage
Create a Home Valuation Report for This Property
The Home Valuation Report is an in-depth analysis detailing your home's value as well as a comparison with similar homes in the area
Home Values in the Area
Average Home Value in this Area
Purchase History
We collect this data history from publicly available records. To have your information removed, we recommend requesting removal directly through your county’s website.
| Date | Buyer | Sale Price | Title Company |
|---|---|---|---|
| Callister Carson Rodger | -- | -- | |
| Callister Carson Rodger | -- | None Available | |
| Majestic Construction & Development Inc | -- | Phillips Hansen Land Title I |
Source: Public Records
Mortgage History
We collect this data history from publicly available records. To have your information removed, we recommend requesting removal directly through your county’s website.
| Date | Status | Borrower | Loan Amount |
|---|---|---|---|
| Open | Callister Carson Rodger | $190,066 | |
| Previous Owner | Majestic Construction & Development Inc | $36,000 |
Source: Public Records
Tax History
| Year | Tax Paid | Tax Assessment Tax Assessment Total Assessment is a certain percentage of the fair market value that is determined by local assessors to be the total taxable value of land and additions on the property. | Land | Improvement |
|---|---|---|---|---|
| 2025 | $3,242 | $504,420 | $150,000 | $354,420 |
| 2024 | $2,937 | $508,572 | $150,000 | $358,572 |
| 2023 | $3,031 | $515,201 | $155,000 | $360,201 |
| 2022 | $2,447 | $237,343 | $24,750 | $212,593 |
| 2021 | $2,111 | $307,744 | $45,000 | $262,744 |
| 2020 | $1,998 | $307,744 | $45,000 | $262,744 |
| 2019 | $1,858 | $152,634 | $24,750 | $127,884 |
| 2018 | $1,649 | $123,707 | $24,008 | $99,699 |
| 2017 | $1,703 | $224,921 | $24,008 | $181,271 |
| 2016 | $1,677 | $118,959 | $24,008 | $94,951 |
| 2015 | $1,529 | $110,328 | $24,008 | $86,320 |
| 2014 | $1,529 | $106,217 | $24,008 | $82,209 |
| 2013 | -- | $106,217 | $24,008 | $82,209 |
Source: Public Records
Map
Nearby Homes
Your Personal Tour Guide
Ask me questions while you tour the home.