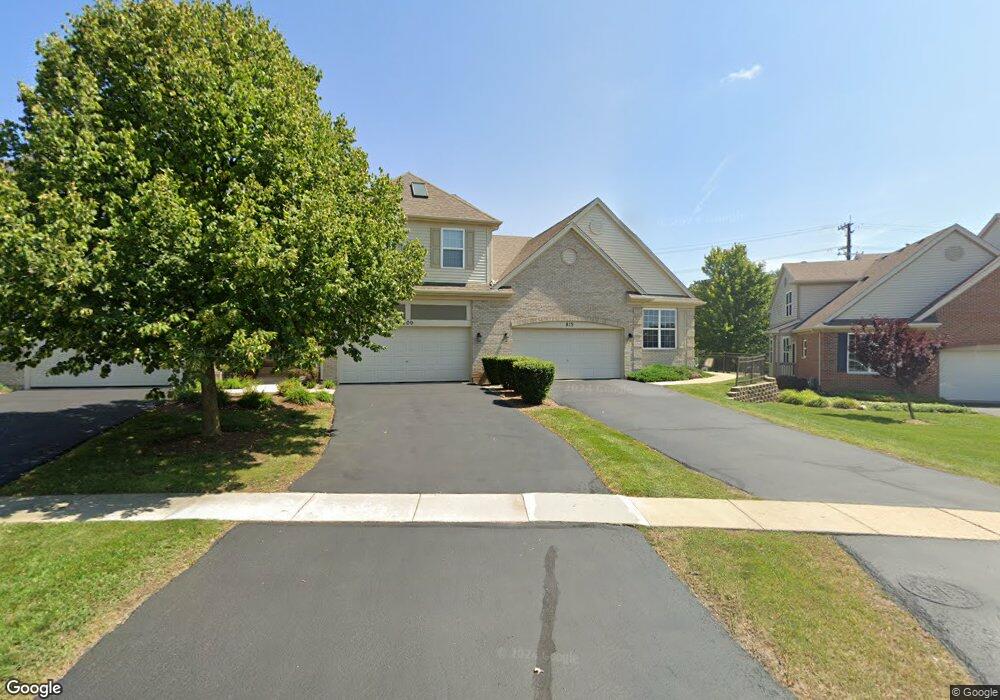
813 Oak Hollow Rd Crystal Lake, IL 60014
Estimated Value: $319,848 - $377,000
3
Beds
3
Baths
1,979
Sq Ft
$176/Sq Ft
Est. Value
About This Home
This home is located at 813 Oak Hollow Rd, Crystal Lake, IL 60014 and is currently estimated at $349,212, approximately $176 per square foot. 813 Oak Hollow Rd is a home located in McHenry County with nearby schools including Coventry Elementary School, Hannah Beardsley Middle School, and Crystal Lake Central High School.
Ownership History
Date
Name
Owned For
Owner Type
Purchase Details
Closed on
Feb 21, 2025
Sold by
Ludwig Ryan P and Ludwig Jessica M
Bought by
Ludwig Ronald P and Ludwig Rita A
Current Estimated Value
Purchase Details
Closed on
Apr 19, 2013
Sold by
Ludwig Ryan P and Ludwig Jessica M
Bought by
Ludwig Ryan P and Ludwig Jessica
Home Financials for this Owner
Home Financials are based on the most recent Mortgage that was taken out on this home.
Original Mortgage
$169,000
Interest Rate
3.75%
Mortgage Type
New Conventional
Purchase Details
Closed on
Dec 21, 2009
Sold by
Klose Marjorie J
Bought by
Ludwig Ryan P
Home Financials for this Owner
Home Financials are based on the most recent Mortgage that was taken out on this home.
Original Mortgage
$168,000
Interest Rate
4.96%
Mortgage Type
New Conventional
Purchase Details
Closed on
Apr 21, 2008
Sold by
Kenar Acquisitions #1 Llc
Bought by
Klose Marjorie J and Clifford F & Marjorie J Klose Declaratio
Create a Home Valuation Report for This Property
The Home Valuation Report is an in-depth analysis detailing your home's value as well as a comparison with similar homes in the area
Home Values in the Area
Average Home Value in this Area
Purchase History
| Date | Buyer | Sale Price | Title Company |
|---|---|---|---|
| Ludwig Ronald P | $200,000 | None Listed On Document | |
| Ludwig Ryan P | -- | First United Title Service I | |
| Ludwig Ryan P | $210,000 | Ticor | |
| Klose Marjorie J | $285,000 | Ticor |
Source: Public Records
Mortgage History
| Date | Status | Borrower | Loan Amount |
|---|---|---|---|
| Previous Owner | Ludwig Ryan P | $169,000 | |
| Previous Owner | Ludwig Ryan P | $168,000 |
Source: Public Records
Tax History Compared to Growth
Tax History
| Year | Tax Paid | Tax Assessment Tax Assessment Total Assessment is a certain percentage of the fair market value that is determined by local assessors to be the total taxable value of land and additions on the property. | Land | Improvement |
|---|---|---|---|---|
| 2024 | $7,182 | $84,830 | $21,778 | $63,052 |
| 2023 | $6,986 | $75,870 | $19,478 | $56,392 |
| 2022 | $6,912 | $72,975 | $17,579 | $55,396 |
| 2021 | $6,566 | $67,985 | $16,377 | $51,608 |
| 2020 | $6,416 | $65,578 | $15,797 | $49,781 |
| 2019 | $6,266 | $62,766 | $15,120 | $47,646 |
| 2018 | $6,297 | $61,831 | $13,968 | $47,863 |
| 2017 | $6,288 | $58,249 | $13,159 | $45,090 |
| 2016 | $6,161 | $54,632 | $12,342 | $42,290 |
| 2013 | -- | $66,327 | $11,514 | $54,813 |
Source: Public Records
Map
Nearby Homes
- 6111 Pingree Rd
- 483 E Crystal Lake Ave
- 4717 Wallens Dr
- 393 & 395 S Oriole Trail
- Lot 1 Virginia St
- 0 Arthur Lot 33 St Unit MRD12290266
- 0 Arthur Lot 026 St Unit MRD12290197
- 0 Arthur Lot 32 St Unit MRD12290256
- 0 Arthur Lot 28 St Unit MRD12290223
- 0 Arthur Lot 27 St Unit MRD12290210
- 0 Arthur Lot 024 St Unit MRD12290187
- 0 Arthur Lot 023 St Unit MRD12289968
- 0 Arthur Lot 022 St Unit MRD12289886
- 0 Arthur Lot 021 St Unit MRD12289863
- 2020 W Rt 176
- 000 SE Route 31 & River Birch SE
- 539 Primrose Ln
- 542 Blackthorn Dr
- 360 Poplar St
- 290 E Congress Pkwy
- 813 Oak Hollow Rd Unit 4
- 809 Oak Hollow Rd
- 809 Oak Hollow Rd Unit 3
- 805 Oak Hollow Rd
- 801 Oak Hollow Rd Unit 801
- 801 Oak Hollow Rd Unit 1
- 829 Oak Hollow Rd
- 821 Oak Hollow Rd
- 833 Oak Hollow Rd
- 825 Oak Hollow Rd
- 817 Oak Hollow Rd
- 191 Regal Dr
- 798 Oak Hollow Rd
- 190 Regal Dr
- 794 Oak Hollow Rd
- 794 Oak Hollow Rd Unit 2
- 187 Regal Dr
- 810 Oak Hollow Rd
- 810 Oak Hollow Rd Unit 1850
- 814 Oak Hollow Rd