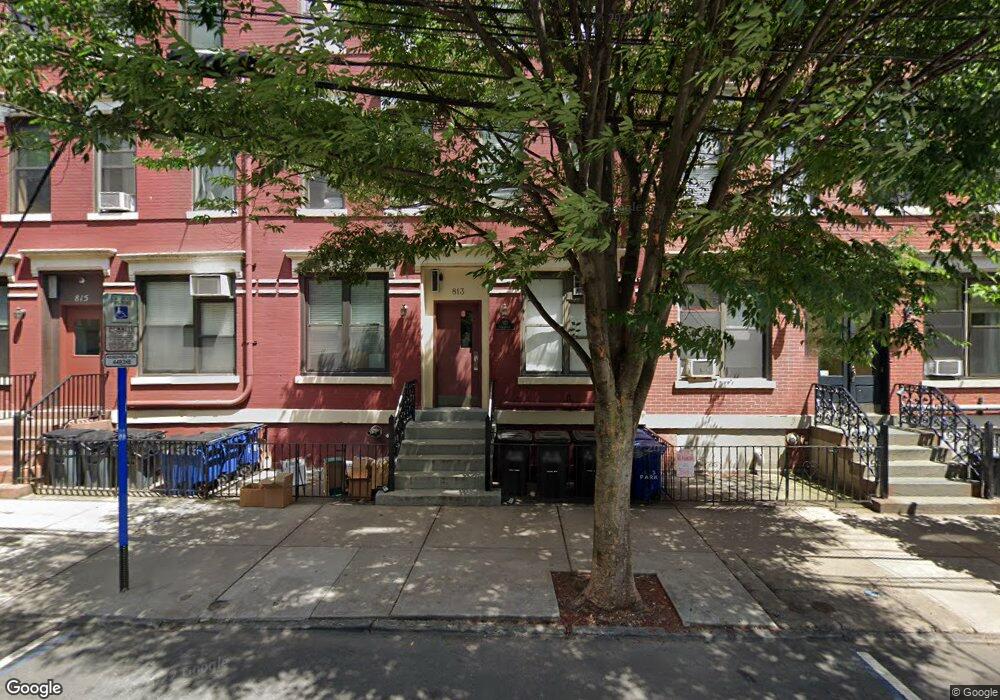
813 Park Ave Unit 2R Hoboken, NJ 07030
Estimated Value: $511,000 - $610,000
--
Bed
--
Bath
701
Sq Ft
$782/Sq Ft
Est. Value
About This Home
This home is located at 813 Park Ave Unit 2R, Hoboken, NJ 07030 and is currently estimated at $547,969, approximately $781 per square foot. 813 Park Ave Unit 2R is a home located in Hudson County with nearby schools including Hoboken High School, Hoboken Charter School, and Mustard Seed School.
Ownership History
Date
Name
Owned For
Owner Type
Purchase Details
Closed on
Mar 1, 2021
Sold by
Chodavadia Kashiben B and Chodavadia Arvind
Bought by
Riley Matthew W and Riley Laurel D
Current Estimated Value
Home Financials for this Owner
Home Financials are based on the most recent Mortgage that was taken out on this home.
Original Mortgage
$374,775
Interest Rate
2.8%
Mortgage Type
New Conventional
Purchase Details
Closed on
Jun 23, 1995
Sold by
Eighth Park Inc
Bought by
Patel Bhagu and Patel Bipin
Create a Home Valuation Report for This Property
The Home Valuation Report is an in-depth analysis detailing your home's value as well as a comparison with similar homes in the area
Home Values in the Area
Average Home Value in this Area
Purchase History
| Date | Buyer | Sale Price | Title Company |
|---|---|---|---|
| Riley Matthew W | $394,500 | All Ahead Title Llc | |
| Patel Bhagu | $57,225 | -- |
Source: Public Records
Mortgage History
| Date | Status | Borrower | Loan Amount |
|---|---|---|---|
| Previous Owner | Riley Matthew W | $374,775 |
Source: Public Records
Tax History Compared to Growth
Tax History
| Year | Tax Paid | Tax Assessment Tax Assessment Total Assessment is a certain percentage of the fair market value that is determined by local assessors to be the total taxable value of land and additions on the property. | Land | Improvement |
|---|---|---|---|---|
| 2025 | $5,771 | $351,800 | $203,000 | $148,800 |
| 2024 | $5,324 | $326,800 | $203,000 | $123,800 |
| 2023 | $5,324 | $326,800 | $203,000 | $123,800 |
| 2022 | $5,232 | $326,800 | $203,000 | $123,800 |
| 2021 | $5,229 | $326,800 | $203,000 | $123,800 |
| 2020 | $5,265 | $326,800 | $203,000 | $123,800 |
| 2019 | $5,226 | $326,800 | $203,000 | $123,800 |
| 2018 | $5,163 | $326,800 | $203,000 | $123,800 |
| 2017 | $5,203 | $326,800 | $203,000 | $123,800 |
| 2016 | $5,069 | $326,800 | $203,000 | $123,800 |
| 2015 | $4,892 | $326,800 | $203,000 | $123,800 |
| 2014 | $4,667 | $326,800 | $203,000 | $123,800 |
Source: Public Records
Map
Nearby Homes
- 812 Bloomfield St Unit 4
- 821 Bloomfield St
- 806 Washington St Unit 3
- 814 Washington St Unit 1
- 103 9th St Unit 4
- 811 Washington St Unit 5R/10
- 829 Washington St Unit 8
- 921 Garden St Unit 3
- 704 Bloomfield St Unit 2
- 815 Willow Ave Unit 2R
- 725 Washington St Unit 5
- 725 Washington St Unit 9
- 704 Garden St
- 919 Park Ave Unit 1R
- 703 Park Ave Unit 1
- 701 Bloomfield St Unit 2
- 914 Washington St
- 911 Willow Ave Unit 1
- 940 Bloomfield St Unit 1
- 107 7th St
- 813 Park Ave Unit 5R
- 813 Park Ave Unit 1R
- 813 Park Ave Unit 3L
- 813 Park Ave Unit 2L
- 813 Park Ave Unit 6L
- 813 Park Ave Unit 4R
- 813 Park Ave Unit 4L
- 813 Park Ave
- 813 Park Ave Unit 1L
- 813 Park Ave Unit 4
- 813 Park Ave Unit 1
- 813 Park Ave Unit 8
- 813 Park Ave Unit 3L/5
- 813 Park Ave Unit 5/3L
- 813 Park Ave Unit 9(5L)
- 813 Park Ave Unit 10 (5L)
- 813 Park Ave Unit 2 (3L)
- 813 Park Ave Unit 2
- 813 Park Ave Unit 3 on 2nd f
- 813 Park Ave Unit 10 (5R)