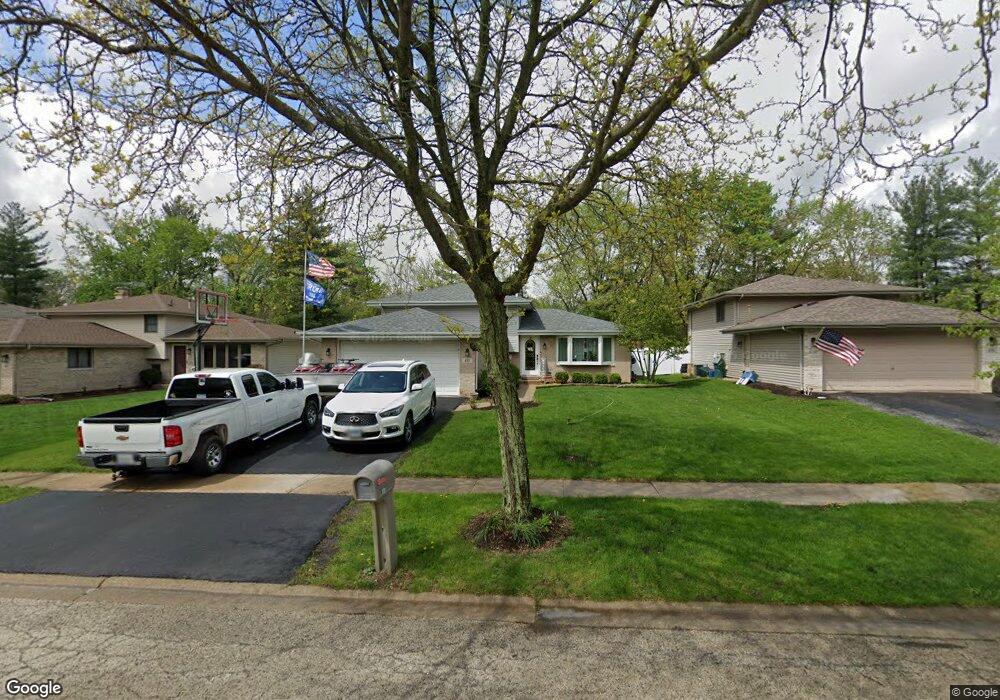
813 Pine Needle Ln Joliet, IL 60432
Estimated Value: $288,876 - $434,000
Studio
--
Bath
--
Sq Ft
9,583
Sq Ft Lot
About This Home
This home is located at 813 Pine Needle Ln, Joliet, IL 60432 and is currently estimated at $377,469. 813 Pine Needle Ln is a home located in Will County with nearby schools including Haines Elementary School, Oster-Oakview School, and Joliet Central High School.
Ownership History
Date
Name
Owned For
Owner Type
Purchase Details
Closed on
May 30, 2014
Sold by
Markulin Robert
Bought by
Markulin Robert and Dibangi Jennifer
Current Estimated Value
Purchase Details
Closed on
Apr 19, 2006
Sold by
Hincks Thomas and Hincks Christine L
Bought by
Markulin Robert S
Home Financials for this Owner
Home Financials are based on the most recent Mortgage that was taken out on this home.
Original Mortgage
$208,000
Outstanding Balance
$118,770
Interest Rate
6.25%
Mortgage Type
Purchase Money Mortgage
Estimated Equity
$258,699
Purchase Details
Closed on
Mar 12, 2001
Sold by
First Midwest Trust Company Natl Assn
Bought by
Hincks Thomas and Hincks Christine
Home Financials for this Owner
Home Financials are based on the most recent Mortgage that was taken out on this home.
Original Mortgage
$138,700
Interest Rate
7.13%
Create a Home Valuation Report for This Property
The Home Valuation Report is an in-depth analysis detailing your home's value as well as a comparison with similar homes in the area
Home Values in the Area
Average Home Value in this Area
Purchase History
| Date | Buyer | Sale Price | Title Company |
|---|---|---|---|
| Markulin Robert | -- | None Available | |
| Markulin Robert S | $260,000 | None Available | |
| Hincks Thomas | $149,000 | Chicago Title Insurance Co |
Source: Public Records
Mortgage History
| Date | Status | Borrower | Loan Amount |
|---|---|---|---|
| Open | Markulin Robert S | $208,000 | |
| Previous Owner | Hincks Thomas | $138,700 |
Source: Public Records
Tax History
| Year | Tax Paid | Tax Assessment Tax Assessment Total Assessment is a certain percentage of the fair market value that is determined by local assessors to be the total taxable value of land and additions on the property. | Land | Improvement |
|---|---|---|---|---|
| 2024 | $6,929 | $88,441 | $26,100 | $62,341 |
| 2023 | $6,929 | $80,621 | $23,792 | $56,829 |
| 2022 | $6,260 | $74,271 | $21,918 | $52,353 |
| 2021 | $5,925 | $69,849 | $20,613 | $49,236 |
| 2020 | $5,739 | $67,357 | $19,878 | $47,479 |
| 2019 | $5,602 | $65,269 | $19,262 | $46,007 |
| 2018 | $5,489 | $63,019 | $18,598 | $44,421 |
| 2017 | $5,362 | $61,207 | $18,063 | $43,144 |
| 2016 | $5,306 | $59,569 | $17,580 | $41,989 |
| 2015 | $5,100 | $57,694 | $17,027 | $40,667 |
| 2014 | $5,100 | $56,982 | $16,817 | $40,165 |
| 2013 | $5,100 | $57,750 | $17,044 | $40,706 |
Source: Public Records
Map
Nearby Homes
- 2909 Bisbee Dr
- 3211 Apache Dr Unit 1
- 1017 Misty Brook Ln
- 935 Saddle Ridge Dr
- 933 Saddle Ridge Dr
- 931 Saddle Ridge Dr
- 2417 Fleetwood Dr
- 1110 Colonial Dr Unit 1
- 14119 W Maple Rd
- 1111 Colonial Dr Unit 1
- 2216 Beechwood Rd
- 2208 Fiesta Dr
- 16440 W Cottonwood Dr
- 0 Silver Cross Blvd
- 1999 Silver Cross Blvd
- 5 Crescent Place
- 15949 Prairie View Ct Unit T5
- 1301 Silver Cross Blvd
- 15959 Prairie View Ct Unit T6
- 37 Argyle Ave
- 811 Pine Needle Ln
- 815 Pine Needle Ln
- 817 Pine Needle Ln
- 809 Pine Needle Ln
- 819 Pine Needle Ln
- 807 Pine Needle Ln
- 814 Pine Needle Ln
- 812 Pine Needle Ln
- 816 Pine Needle Ln
- 810 Pine Needle Ln
- 821 Pine Needle Ln
- 818 Pine Needle Ln
- 808 Pine Needle Ln
- 805 Pine Needle Ln
- 2824 Golf Rd
- 820 Pine Needle Ln
- 803 Pine Needle Ln
- 806 Pine Needle Ln
- 822 Pine Needle Ln
- 2850 Golf Rd
Your Personal Tour Guide
Ask me questions while you tour the home.