813 Putnam St Antioch, CA 94509
Contra Loma NeighborhoodEstimated Value: $576,663 - $660,000
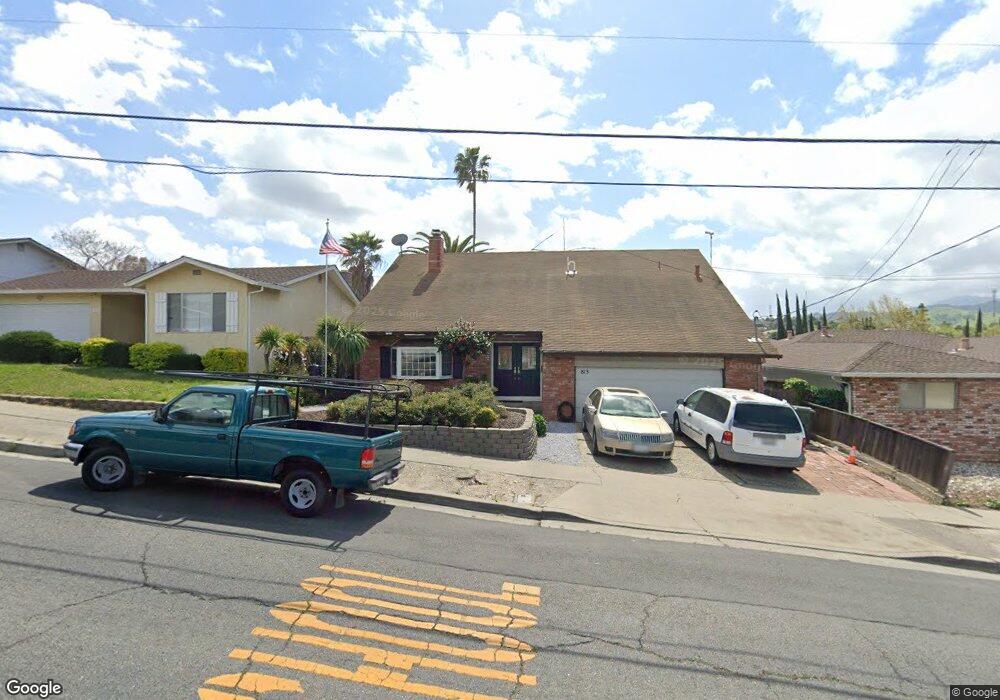
About This Home
This home is located at 813 Putnam St, Antioch, CA 94509 and is currently estimated at $626,166, approximately $304 per square foot. 813 Putnam St is a home located in Contra Costa County with nearby schools including Marsh Elementary School, Park Middle School, and Antioch High School.
Ownership History
We collect this data history from publicly available records. To have your information removed, we recommend requesting removal directly through your county’s website.
Purchase Details
Home Financials for this Owner
Home Financials are based on the most recent Mortgage that was taken out on this home.Home Values in the Area
Average Home Value in this Area
Purchase History
We collect this data history from publicly available records. To have your information removed, we recommend requesting removal directly through your county’s website.
| Date | Buyer | Sale Price | Title Company |
|---|---|---|---|
| -- | First American Title |
Mortgage History
We collect this data history from publicly available records. To have your information removed, we recommend requesting removal directly through your county’s website.
| Date | Status | Borrower | Loan Amount |
|---|---|---|---|
| Open | $418,595 | ||
| Closed | $429,030 | ||
| Closed | $40,000 | ||
| Closed | $305,000 | ||
| Closed | $40,000 | ||
| Closed | $234,500 | ||
| Closed | $204,000 | ||
| Closed | $152,000 |
Tax History
We collect this data history from publicly available records. To have your information removed, we recommend requesting removal directly through your county’s website.
| Year | Tax Paid | Tax Assessment Tax Assessment Total Assessment is a certain percentage of the fair market value that is determined by local assessors to be the total taxable value of land and additions on the property. | Land | Improvement |
|---|---|---|---|---|
| 2026 | $3,170 | $243,815 | $66,360 | $177,455 |
| 2025 | $3,170 | $239,035 | $65,059 | $173,976 |
| 2024 | $2,994 | $234,349 | $63,784 | $170,565 |
| 2023 | $2,994 | $229,755 | $62,534 | $167,221 |
| 2022 | $2,950 | $225,251 | $61,308 | $163,943 |
| 2021 | $2,833 | $220,835 | $60,106 | $160,729 |
| 2019 | $2,785 | $214,286 | $58,324 | $155,962 |
| 2018 | $2,686 | $210,085 | $57,181 | $152,904 |
| 2017 | $2,614 | $205,966 | $56,060 | $149,906 |
| 2016 | $2,546 | $201,928 | $54,961 | $146,967 |
| 2015 | $2,517 | $198,896 | $54,136 | $144,760 |
| 2014 | $2,440 | $195,001 | $53,076 | $141,925 |
Map
- 2803 Minta Ln
- 1029 Doncaster Dr
- 800 Gloucester St
- 509 Putnam St
- 1108 Putnam St
- 2924 Elizabeth Ln
- 200 Tanganyka Ct
- 1126 Mission Dr
- 2917 El Dorado Way
- 2717 D St
- 3109 Brook Ct
- 2404 Peppertree Ct Unit 1
- 26 Wightman Ct
- 1124 Monterey Dr
- 239 Rossi Ave
- 3017 Hickorynut St
- 2900 Rio Grande Dr
- 2408 Lemontree Ct Unit 1
- 310 W Madill St
- 7 Lawrence Ave
Ask me questions while you tour the home.